


Quarterly Theory (Part 1): Where Is the Gold Market Hiding Its Liquidity?
Quarterly Theory · Part 1
Where Is the Market Hiding Its Liquidity?
Reading gold through quarters, Fibonacci time zones and Gann’s 0.666 octave
Most traders study price. Very few study time. After years of watching gold, I noticed that the biggest moves are rarely random in time — they cluster around the same parts of each quarter. Quarterly Theory is my way of turning that observation into a repeatable map.
This is the first part of a series. In this post I explain why the calendar quarter matters, what Quarterly Theory is, and how I use a customised Fibonacci time zone — built on W.D. Gann’s 0.5 and 0.666 levels — to locate where most of the liquidity is parked on the gold daily chart. Then I walk you through two real examples from 2026.
Big money works on a quarterly clock — funds report, rebalance and get judged every three months. Their orders leave footprints in time, not only in price.
Quarterly Theory splits time into quarters and asks one question: in which part of the quarter was the real position built? That zone is where liquidity is parked.
Anchor a Fibonacci time zone on the quarter, mark the 0.5 → 0.666 window, box the price range inside it, and watch how price reacts when it comes back.
Quarterly Theory: time is fractal
Every block of time can be divided into four quarters — and each quarter into four again. A year has four quarters. A quarter has three months, roughly thirteen weeks. A month has about four weeks, a week has its trading days, and a trading day has its sessions. The same rhythm repeats from the yearly chart all the way down to the intraday chart.
For swing traders and investors, the most useful unit is the calendar quarter: Q1 (Jan–Mar), Q2 (Apr–Jun), Q3 (Jul–Sep) and Q4 (Oct–Dec). In this part we study Q1 and Q2 of 2026 on the gold daily chart.
Why the quarter is where big money lives
Liquidity is not spread evenly through time. Institutions operate on quarterly clocks, so their accumulation and distribution tend to concentrate inside specific windows of the quarter.
Portfolio rebalancing
Pension funds, ETFs and asset managers rebalance on quarterly schedules, creating large, predictable order flow.
Quarterly reporting
Fund performance is judged every quarter, so positions are often built, defended or closed around quarter boundaries.
Data on a quarterly cycle
GDP releases and the World Gold Council’s Gold Demand Trends arrive quarterly and reset the market’s narrative.
Quarterly contract cycles
Many index futures and options follow a Mar / Jun / Sep / Dec cycle, forcing rolls and repositioning.
W.D. Gann: the man who traded time
William Delbert Gann (1878–1955) was born in Lufkin, Texas, and started out in the cotton trade. He went on to become one of the most studied — and most debated — market technicians of the 20th century. His core belief was simple and powerful: when time is up, price must change.
The Ticker and Investment Digest reported on a month of Gann’s trading under observation, with a remarkably high win rate.
His idea that markets move in natural, repeating cycles of time and price.
Truth of the Stock Tape (1923), Tunnel Thru the Air (1927), 45 Years in Wall Street (1949).
I treat the 1909 story as history and inspiration, not as a promise of results. What matters for us is the framework he left behind.
Gann’s octave: why 0.5 and 0.666 matter
Gann divided any range — of price or of time — into eighths, like the eight notes of a musical octave, and into thirds. He treated the halfway point (4/8 = 0.5) and the two-thirds point (2/3 = 0.666) as among the most important levels of any range.
Applied to time, 0.5 and 0.666 mark the point where a quarter turns from exploration into commitment. That is the window I mark in every quarter.
The Fibonacci time zone tool
Most traders know Fibonacci retracements, which measure price. Fibonacci time zones measure time: they are vertical lines projected forward from a starting point. The default tool spaces those lines on the Fibonacci sequence (1, 2, 3, 5, 8, 13…) to flag when a turn might come.
I use it differently. I stretch the tool across exactly one quarter, so I can read any fraction of that quarter precisely — and I set the levels to Gann’s proportions instead of the default sequence.
My custom settings (TradingView)
- Open the gold (XAUUSD) daily chart.
- Select the Fib Time Zone tool and switch off the default levels.
- Add levels 0, 0.5, 0.666 and 1 — I colour 0.5 red and 0.666 blue.
- Click the quarter’s first day (0), then its last day (1). For example: 1 Jan → 1 Apr.
Marking the quarterly liquidity zone
- Find the highest high and lowest low of the candles between the 0.5 and 0.666 lines.
- Draw a box over that range and a line at its 50% level — the equilibrium.
- Extend the box to the right, into the following quarters.
- Watch the reaction when price returns: rejection, acceptance or a clean break.
In my view, this box is where the quarter’s real positions were built. Orders that are still open — and the stops resting around them — turn it into a pool of liquidity that price tends to revisit.
Try it: find the window for any quarter
Calendar-day estimate. On your chart, the tool counts bars, so the lines may shift by a day or two around weekends and holidays.
Example 1 — Q1 2026 (January → March)
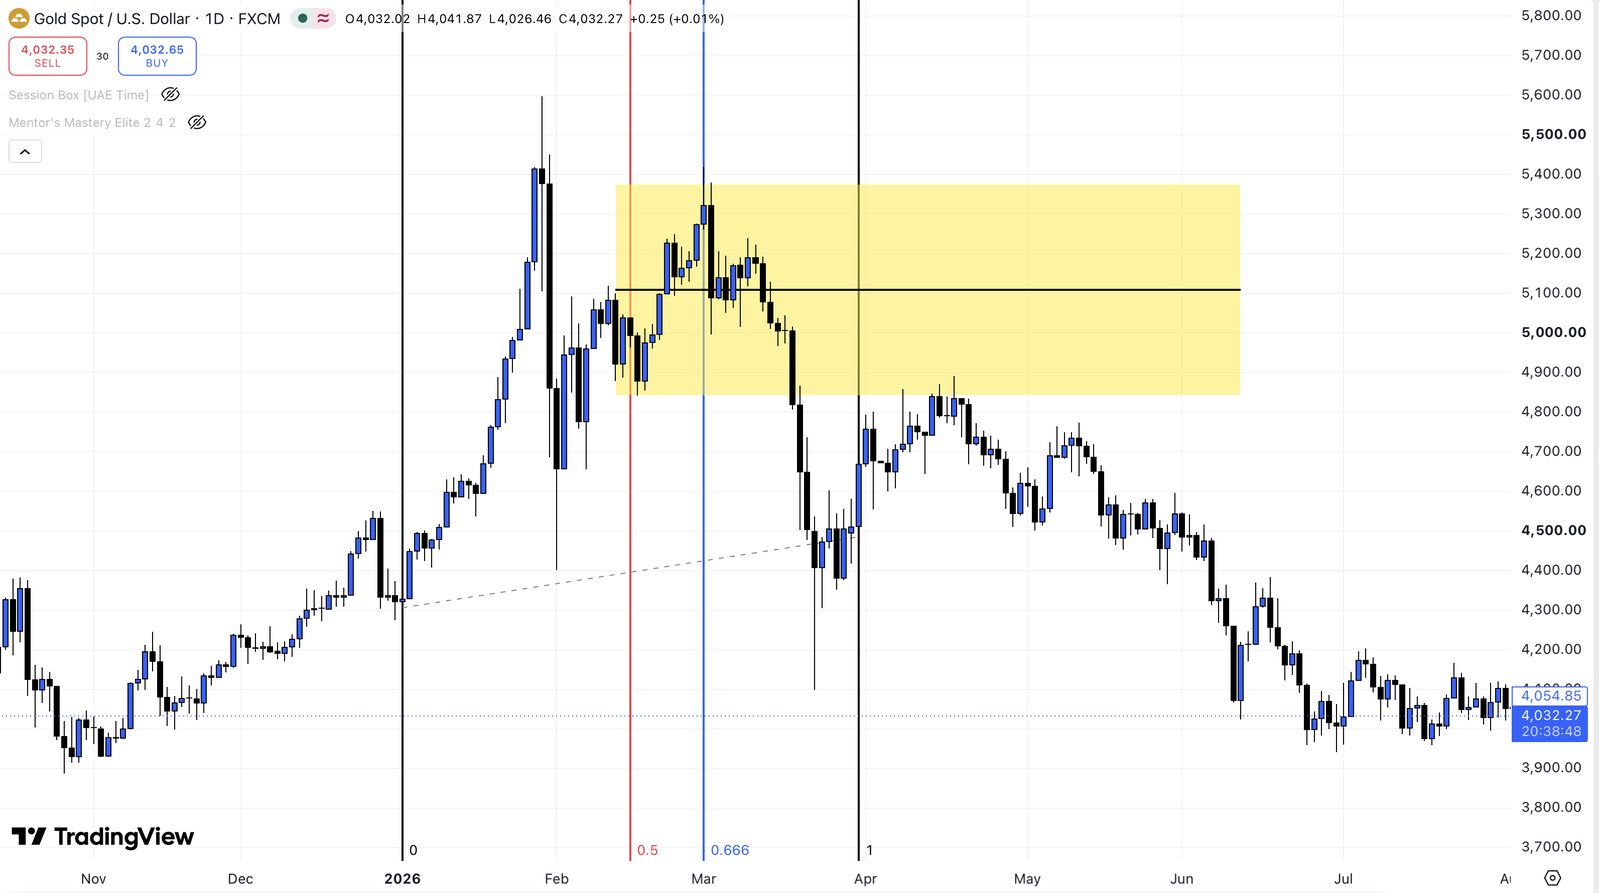
January ran to a record wick near 5,600, and gold swung wildly from there. Inside the 0.5 → 0.666 window, price built its range — topping just after the 0.666 line. In March, gold broke down hard from the zone toward 4,100.
The interesting part came next. April’s recovery stalled right under the bottom of the box, around 4,880. The zone had turned into a ceiling. From there, gold slid to roughly 3,950 by July.
Example 2 — Q2 2026 (April → June)
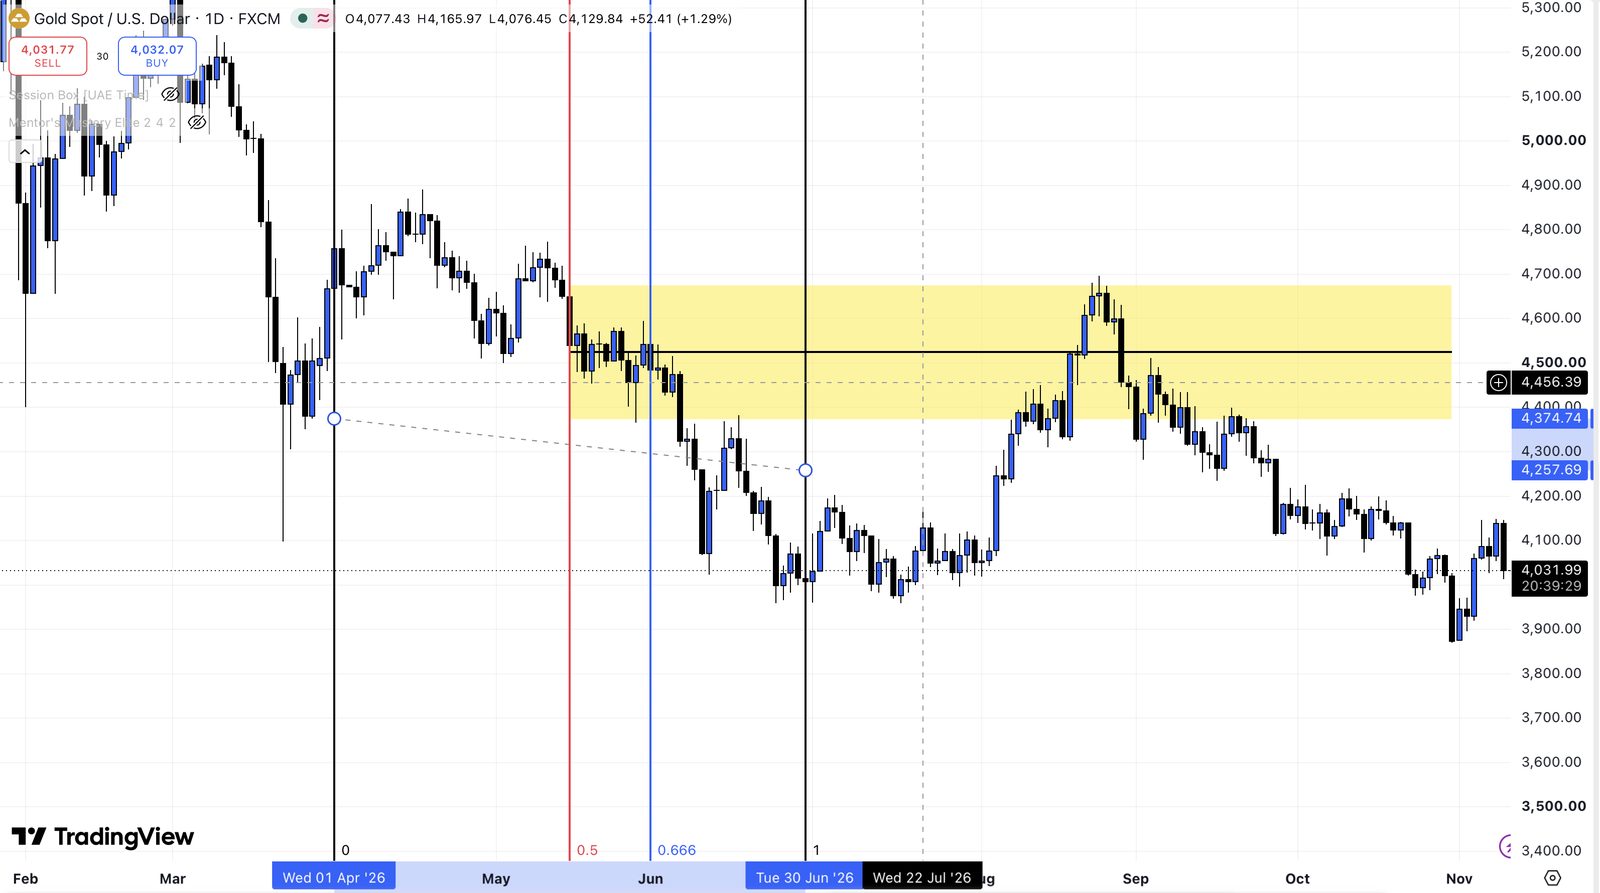
Price chopped through April and May, then compressed inside the window. In early June the range broke lower, and gold fell to the 3,950 area in July.
Then, in late August, price came back into the box and tagged its top near 4,690. The zone rejected it, and gold rolled back to around 4,030 by November. Months later, the Q2 box was still the level that mattered.
What both quarters taught us
The window builds the position
In both quarters, the 0.5 → 0.666 window held the range that defined what came next.
Price leaves — then returns
Q1’s box was retested in April. Q2’s box was retested in August.
The zone flips roles
Once broken, the box acted as resistance on the return. In bullish phases, expect the mirror image.
Equilibrium is the pivot
The midline shows who is in control: holding above it is strength, below it is weakness.
Two examples are not proof — they are a map. In the coming parts I will add more quarters and show how to confirm these reactions on lower timeframes.
Why gold deserves your attention
Safe haven
Demand rises when fear rises — wars, crises, currency stress.
Inflation hedge
A store of value that no central bank can print.
Deep & liquid
Trades almost around the clock, from Asia to London to New York.
Clear structure
Large liquidity makes zones and reactions easier to read.
Time effects in markets: what research shows
Quarterly Theory is a practitioner’s framework. But the idea that time influences returns has a long research history:
| Source | What it shows |
|---|---|
| Rozeff & Kinney (1976) Journal of Financial Economics |
Documented the “January effect” — returns clustering in a specific part of the calendar year. |
| Baur (2013) “The autumn effect of gold” |
Found gold’s returns were notably stronger in September and November than in other months. |
| World Gold Council Gold Demand Trends |
The industry’s main data report is itself published quarter by quarter — the market literally thinks in quarters. |
| W.D. Gann (1909) The Ticker and Investment Digest |
An early, much-quoted record of a trader who timed markets by cycles of time. |
These studies don’t prove Quarterly Theory. They show that calendar and cycle effects are taken seriously in finance research.
Using the zone: traders vs investors
For traders
- Treat the box as a reaction area, not an automatic entry.
- Wait for confirmation on the 4H / 1H when price returns.
- Use the equilibrium as a pivot and the far edge for invalidation.
- Size every position so one loss is small.
For investors
- Use the zone to judge whether gold is expensive or cheap within its current cycle.
- Stagger purchases near the lower edge of an active zone instead of chasing breakouts.
- Review the picture once per quarter, not every day.
Next on the clock
Q4 2026: the window opens this month
Anchoring 0 at 1 October and 1 at 1 January, the 0.5 line lands around 16 November and 0.666 around 1 December. Mark the range that forms there — that is the box we will study together.
Part 2 is coming — stay tuned. Follow the series here on thisismj.com and join our Delta Trading Academy live sessions to learn Quarterly Theory step by step.
— Mujeeb Rahman P