


Proof on the Chart: Our 2025–2026 Live-Market Track Record.
Anyone can explain a chart after the move. The real test is posting the entry, the stop and the target before the market moves, with a timestamp nobody can edit.
This post collects 17 calls shared with our community across 2025 and 2026, from the premium Discord channel, the WhatsApp Live Trading Room and live YouTube sessions. Each one shows the original call, the result, and the reasoning behind it.
The toolkit behind every call
No single indicator. Every call below is a confluence of a few of these methods:
- Gann levels & time: price and time cycles that mark turning points
- MSNR: old support becomes new resistance, and vice versa
- Liquidity: where the stops sit, and where price is drawn next
- Price action: candles, wicks and breaks that confirm intent
- Elliott wave: impulse and correction, where we are in the story
- XABCD harmonics: measured patterns with defined reversal zones
- Supply & demand: zones where institutions left unfinished orders
- Wyckoff: accumulation, distribution and the spring
- Trendlines & structure: CHoCH, BOS, wedges and retests
All times are as shown in the original posts (GST, UTC+4).
2025: eleven calls, eleven timestamps
| Posted | Market | Call | Entry | Result | Time |
|---|---|---|---|---|---|
| 26 Jan | XAUUSD | Buy · weekly | 2,737 | Both targets, +333 pts | ~2 months |
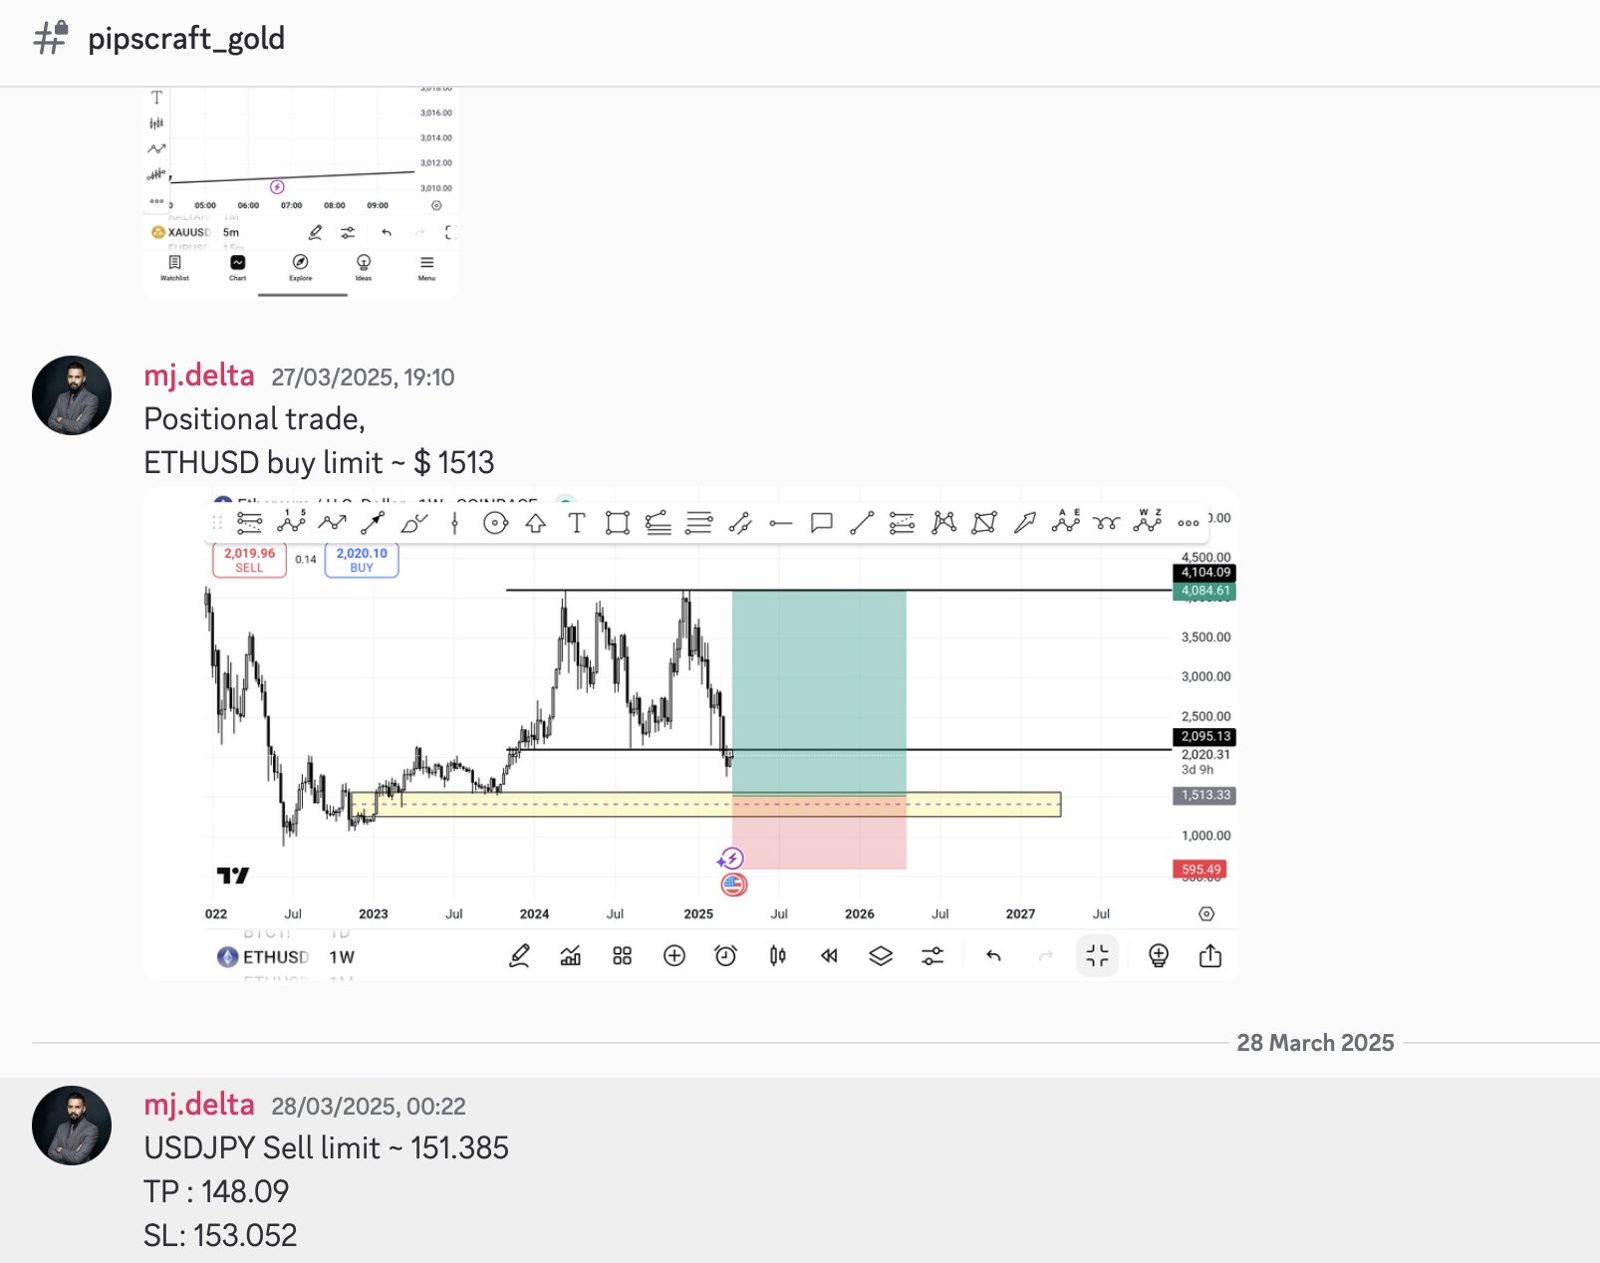
| 27 Mar | ETHUSD | Buy limit · weekly | 1,513 | Booked +151% | ~4 months |
| 27 Mar | XAUUSD | Buy · 5 min | 3,024 | Target, 1 : 2.2 | 39 minutes |
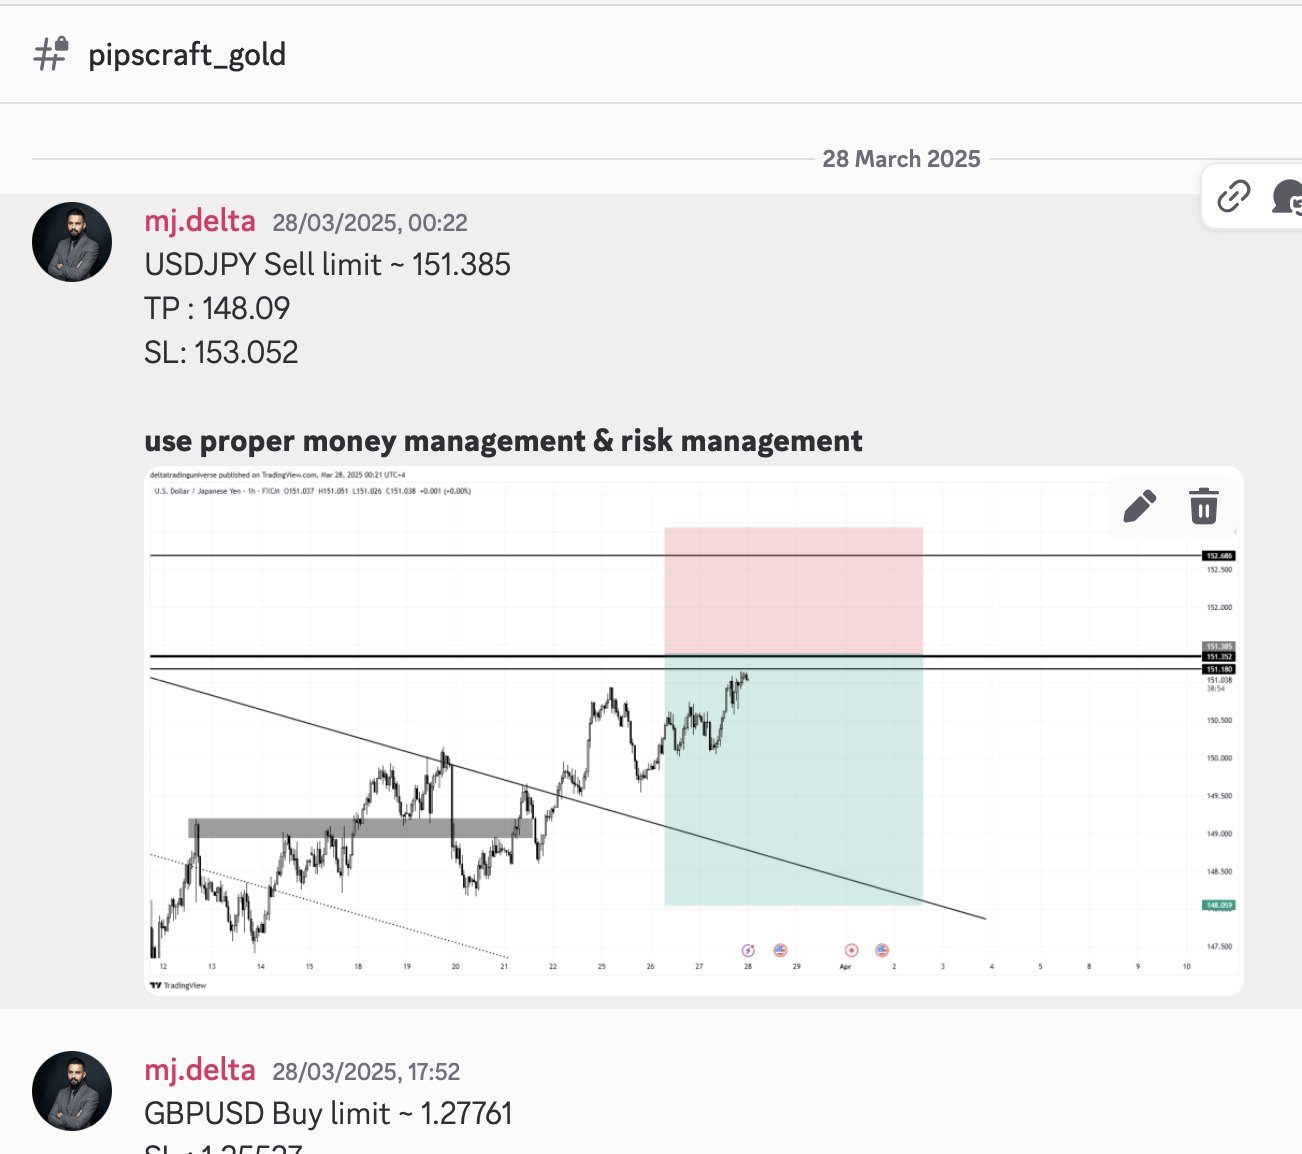
| 28 Mar | USDJPY | Sell limit · 1H | 151.385 | Target, +329 pips | 6 days |
| 8 Apr | US100 | Buy limit · 30 min | 17,055 | Target, +1,770 pts | < 24 hours |
| 21 Apr | EURGBP | Buy limit · daily | 0.84227 | Exit, +231 pips | ~3 months |
| 22 Apr | EURGBP | Sell · 2H | 0.85674 | SL in profit, +74 pips | 9 days |
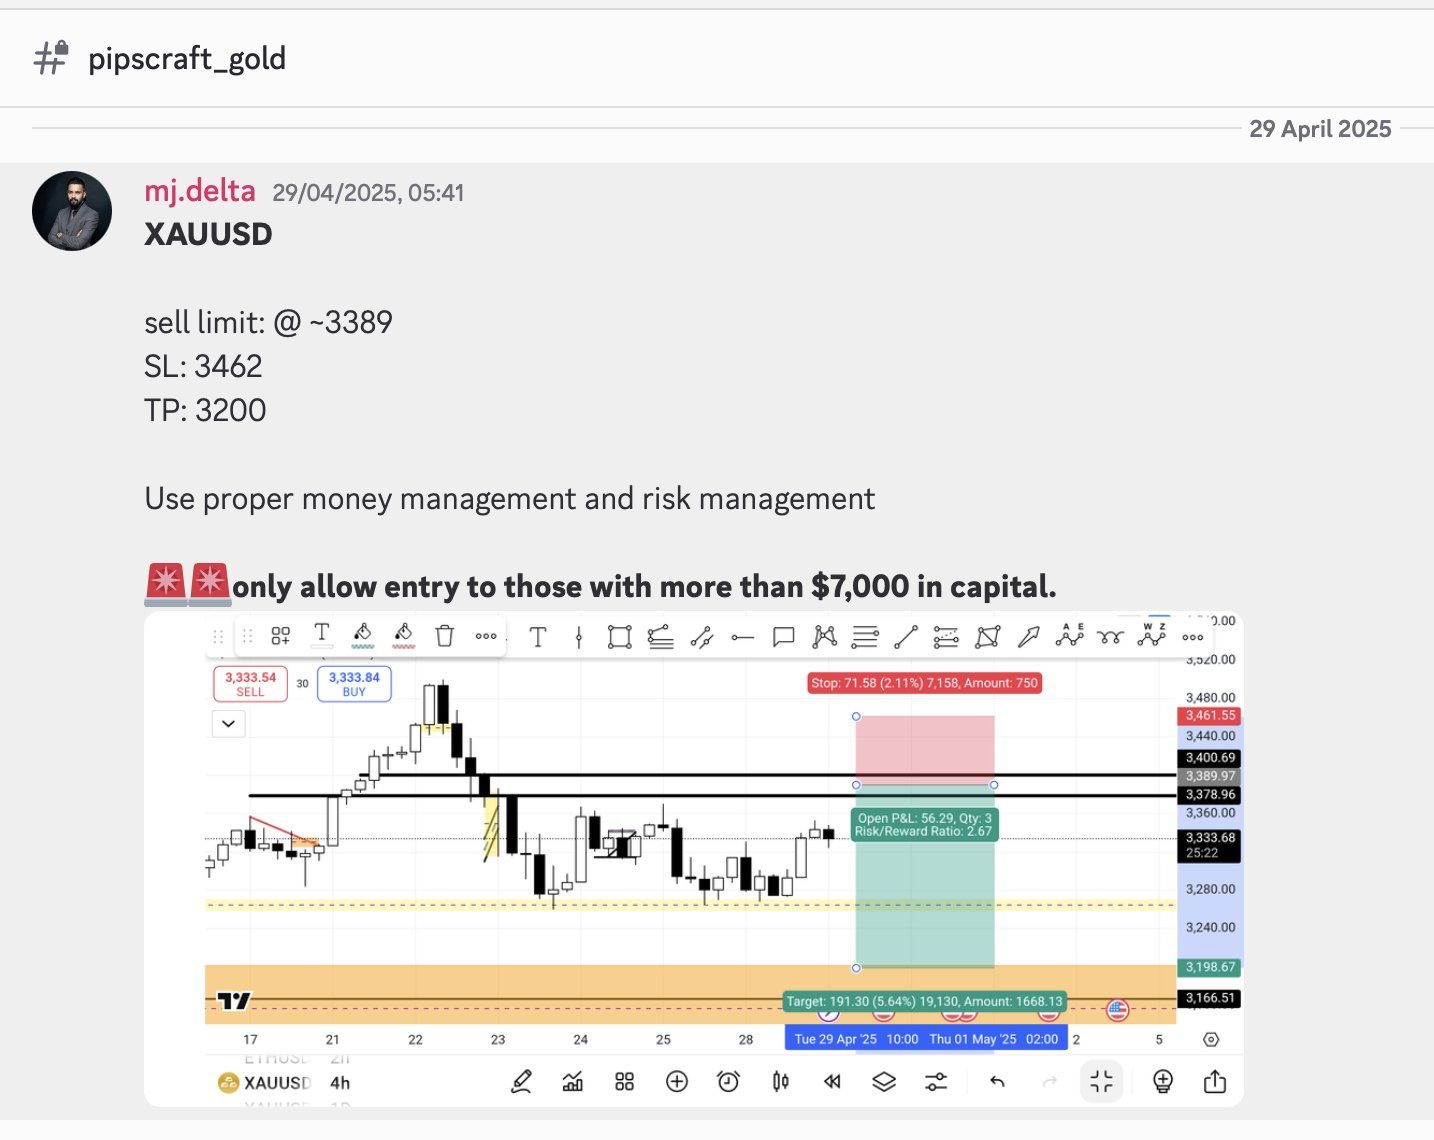
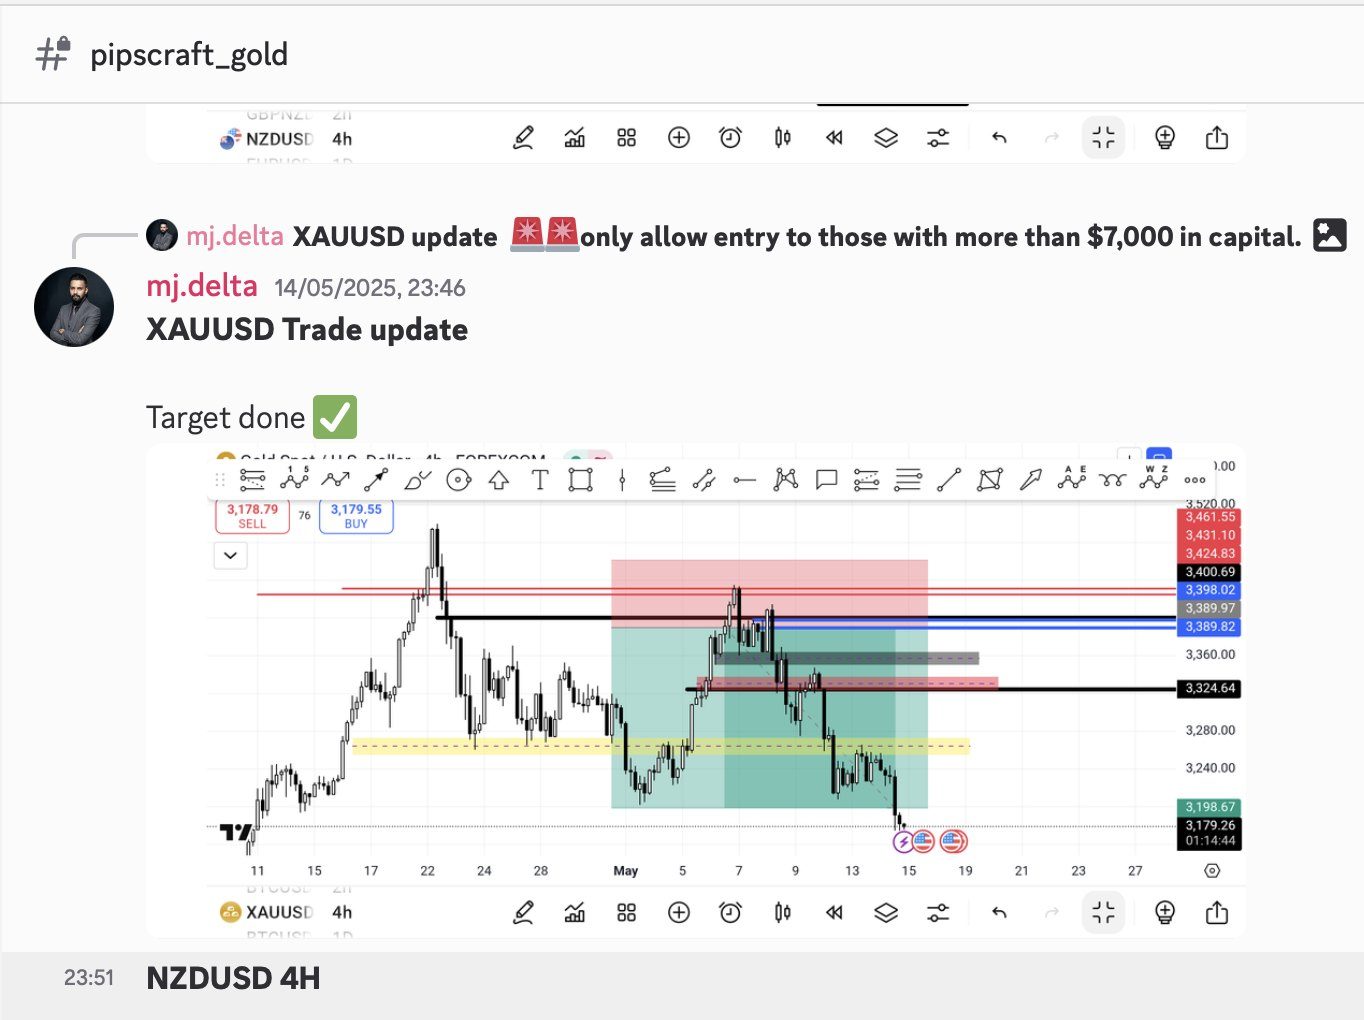
| 29 Apr | XAUUSD | Sell limit · 4H | 3,389 | Target, +189 pts | ~2 weeks |
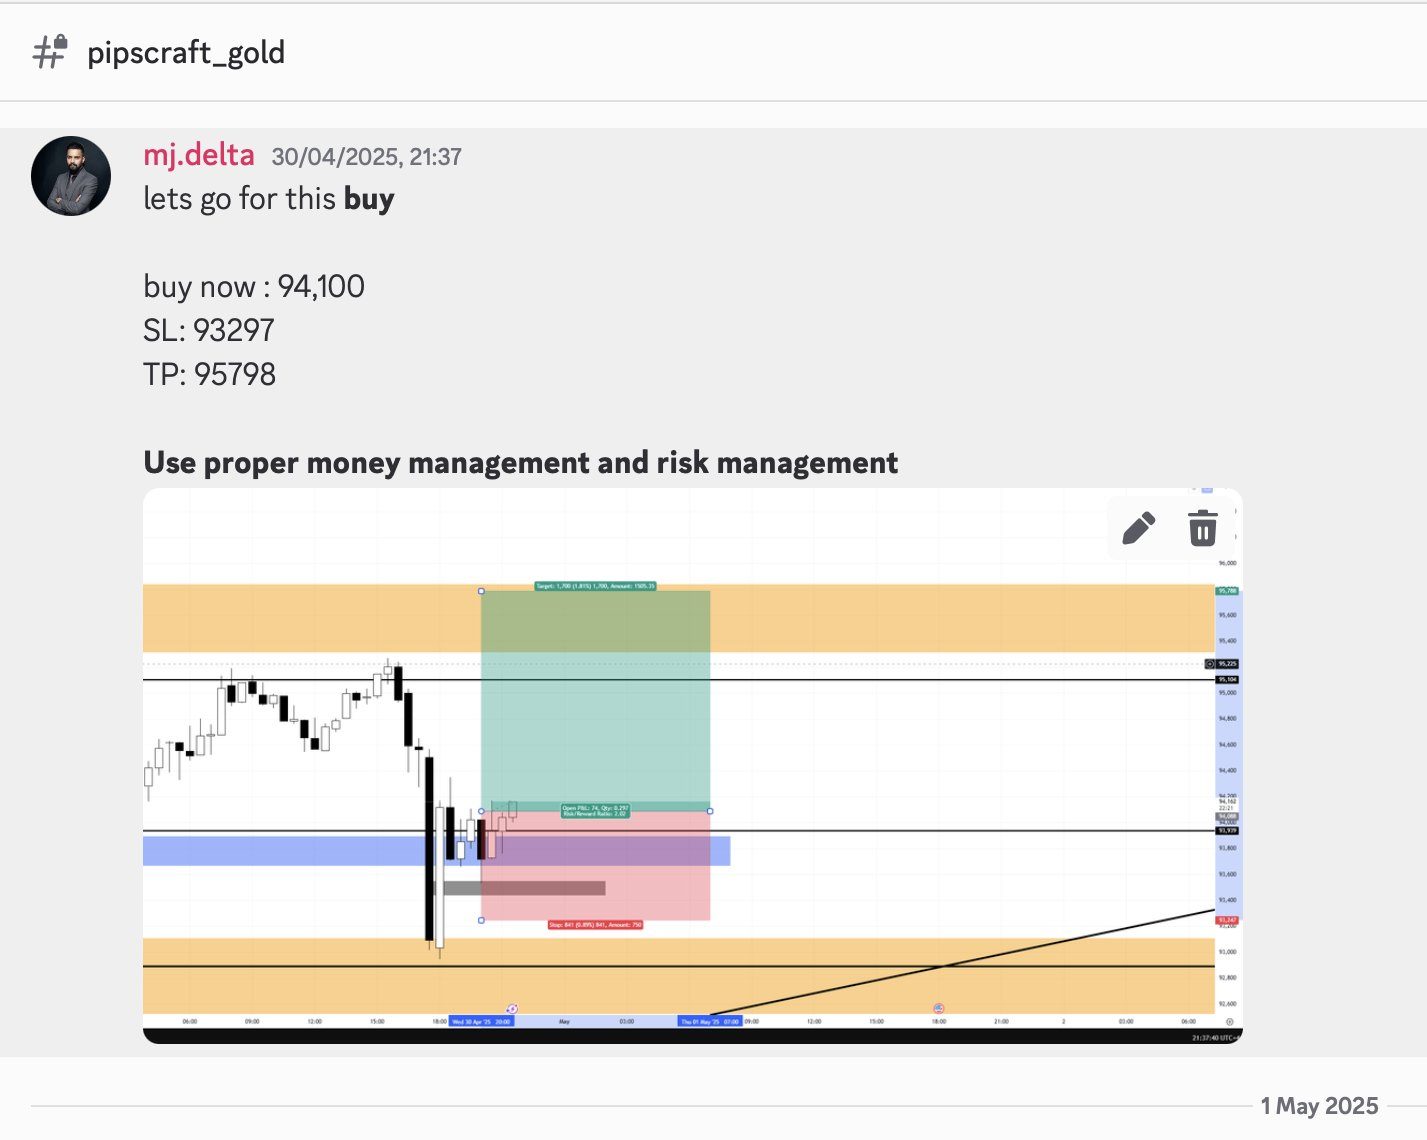
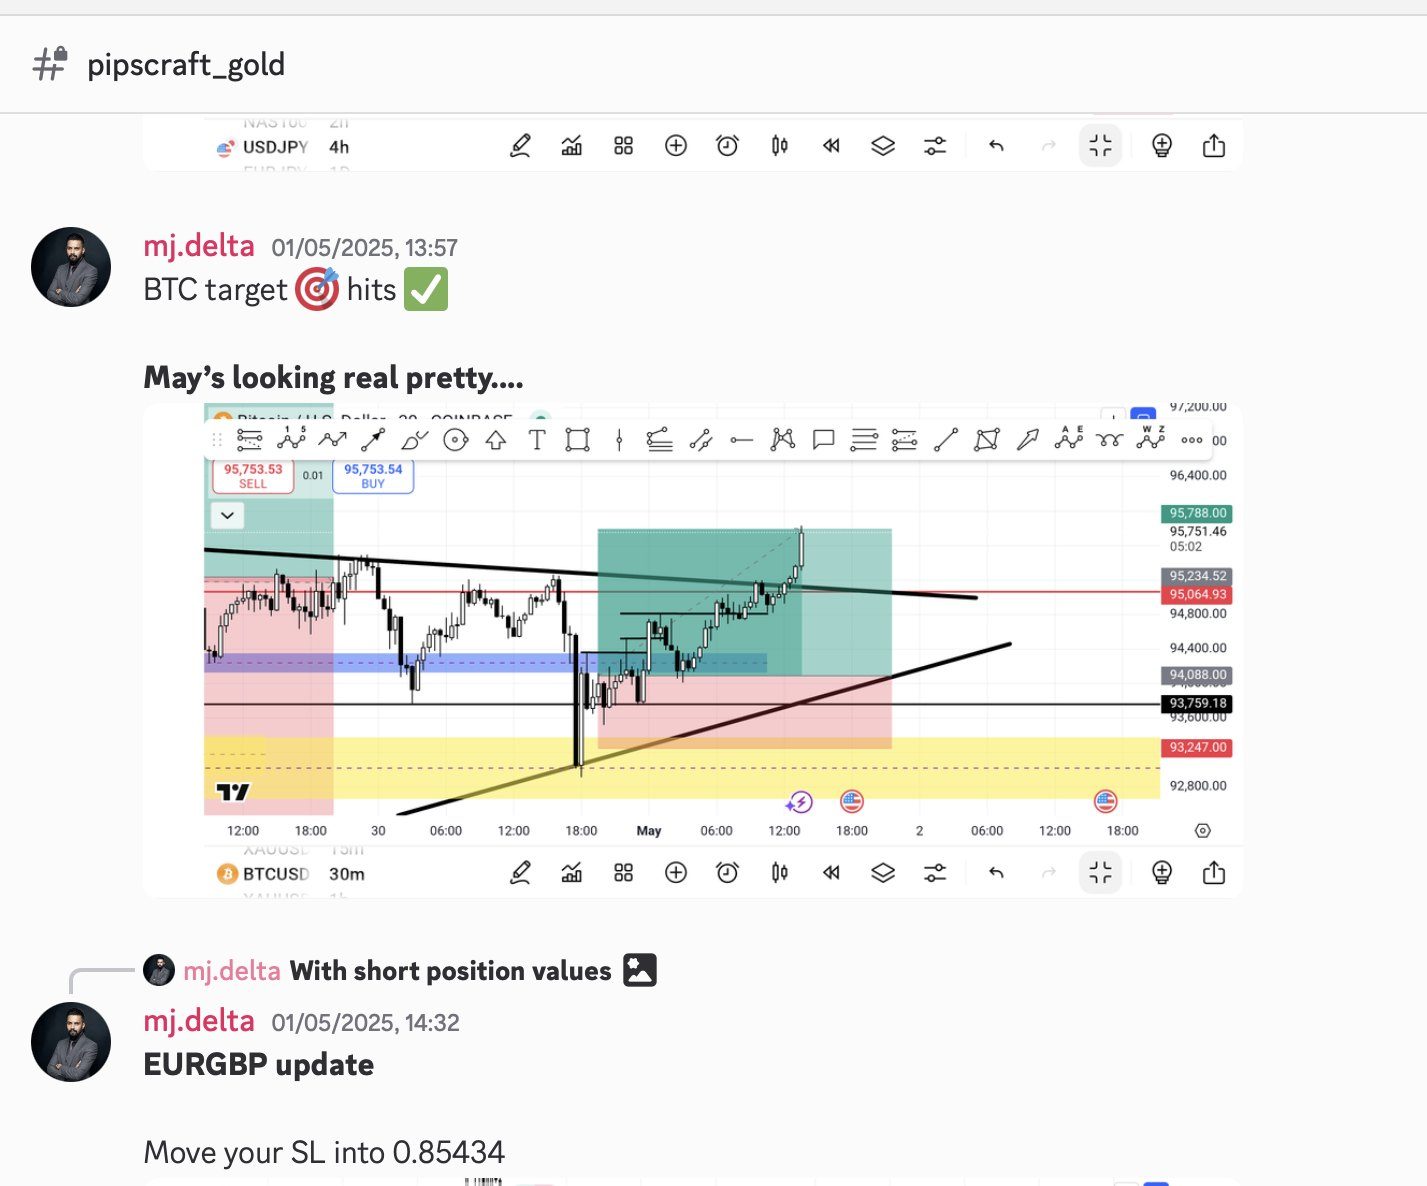
| 30 Apr | BTCUSD | Buy · 30 min | 94,100 | Target, +1,698 | 16 hours |
| 10 Jun | USDJPY | Sell limit · 1H | 145.419 | Booked, +187 pips | 2 days |
| 11 Jun | NZDUSD | Sell limit · 4H | 0.61111 | Exit, +147 pips | ~6 weeks |
1. Gold: The $2,737 Call That Ran to $3,070
January 2025. While most traders waited for a dip, the weekly chart was already saying “buy”.
+333 pts Both targets · ~2 months

Why it worked
The weekly Heikin Ashi candle flipped green after a 3-month base and closed right at the old highs. When a trend pauses at the top and refuses to fall, it’s building fuel, not dying.
What happened
Gold cleared T1, broke the historic $3,000 mark on 14 Mar and traded above T2 ($3,070) before March ended.
2. Ethereum: Buying the Fear at $1,513
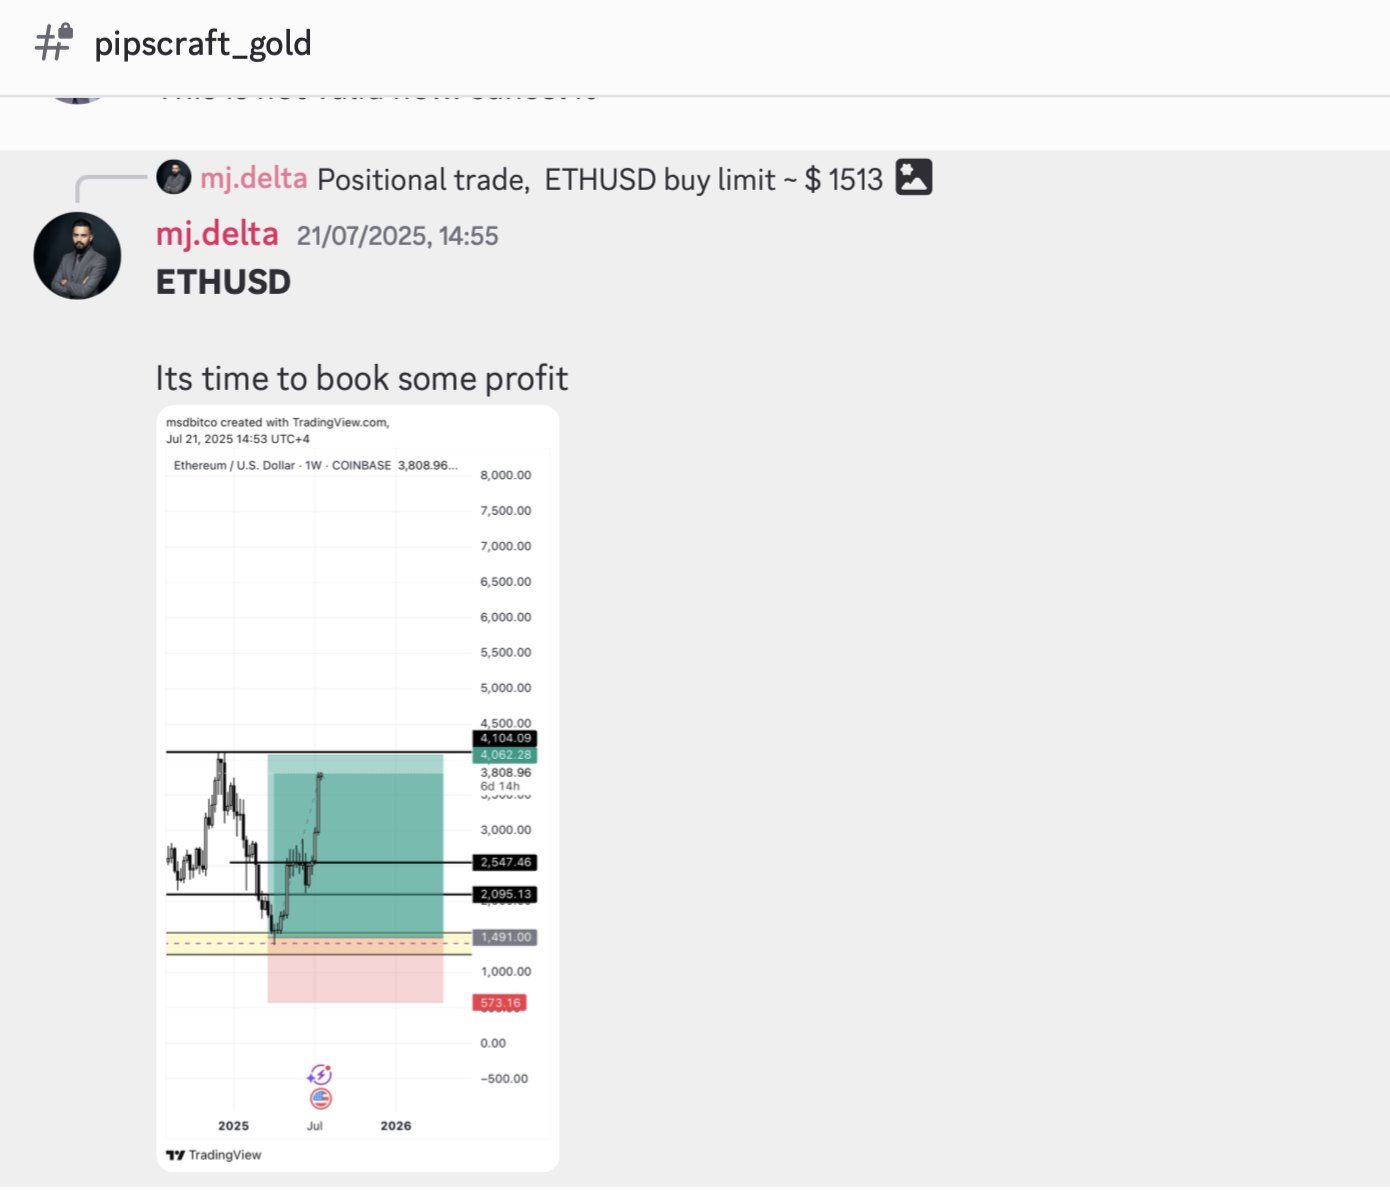
Posted in March 2025. Filled in the April panic. Cashed out above $3,800 in July.
+151% Positional · ~4 months
Why it worked
The 2022–23 accumulation base on the weekly chart was a demand zone price had never come back to. The order sat there and waited. No chasing, no FOMO.
What happened
ETH flushed into the zone in April and reversed hard: $2,720 by 10 Jun, then $3,808 when profits were booked on 21 Jul 2025.
3. USDJPY: Sold the Ceiling Before the Crash
A sell limit at 151.385, placed days before the April 2025 tariff shock hit every market.
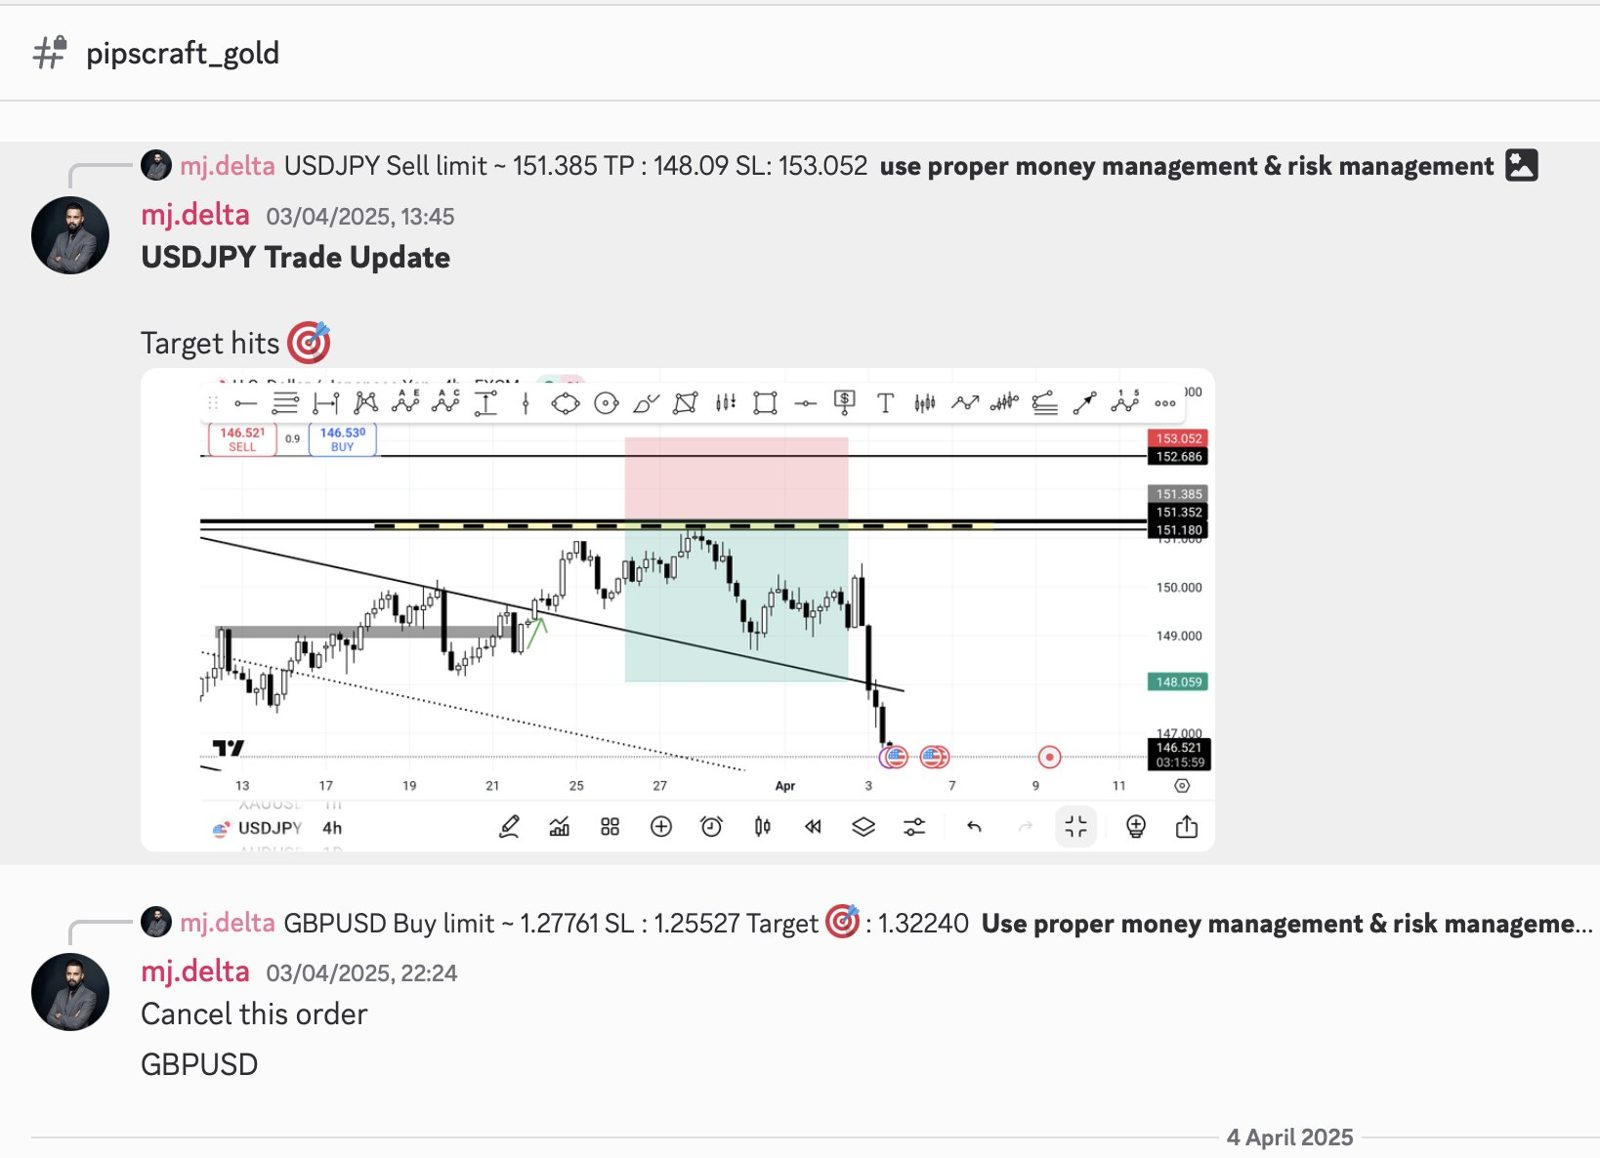
+329 pips Target hit in 6 days
Why it worked
Price was climbing into double resistance at 151.18–151.38 (MSNR) after retesting a broken trendline. That’s exactly where late buyers park their stops.
What happened
USDJPY topped at our zone, rolled over, then collapsed through 148.09 on 3 Apr. It kept falling to ~146.5, well past the target.
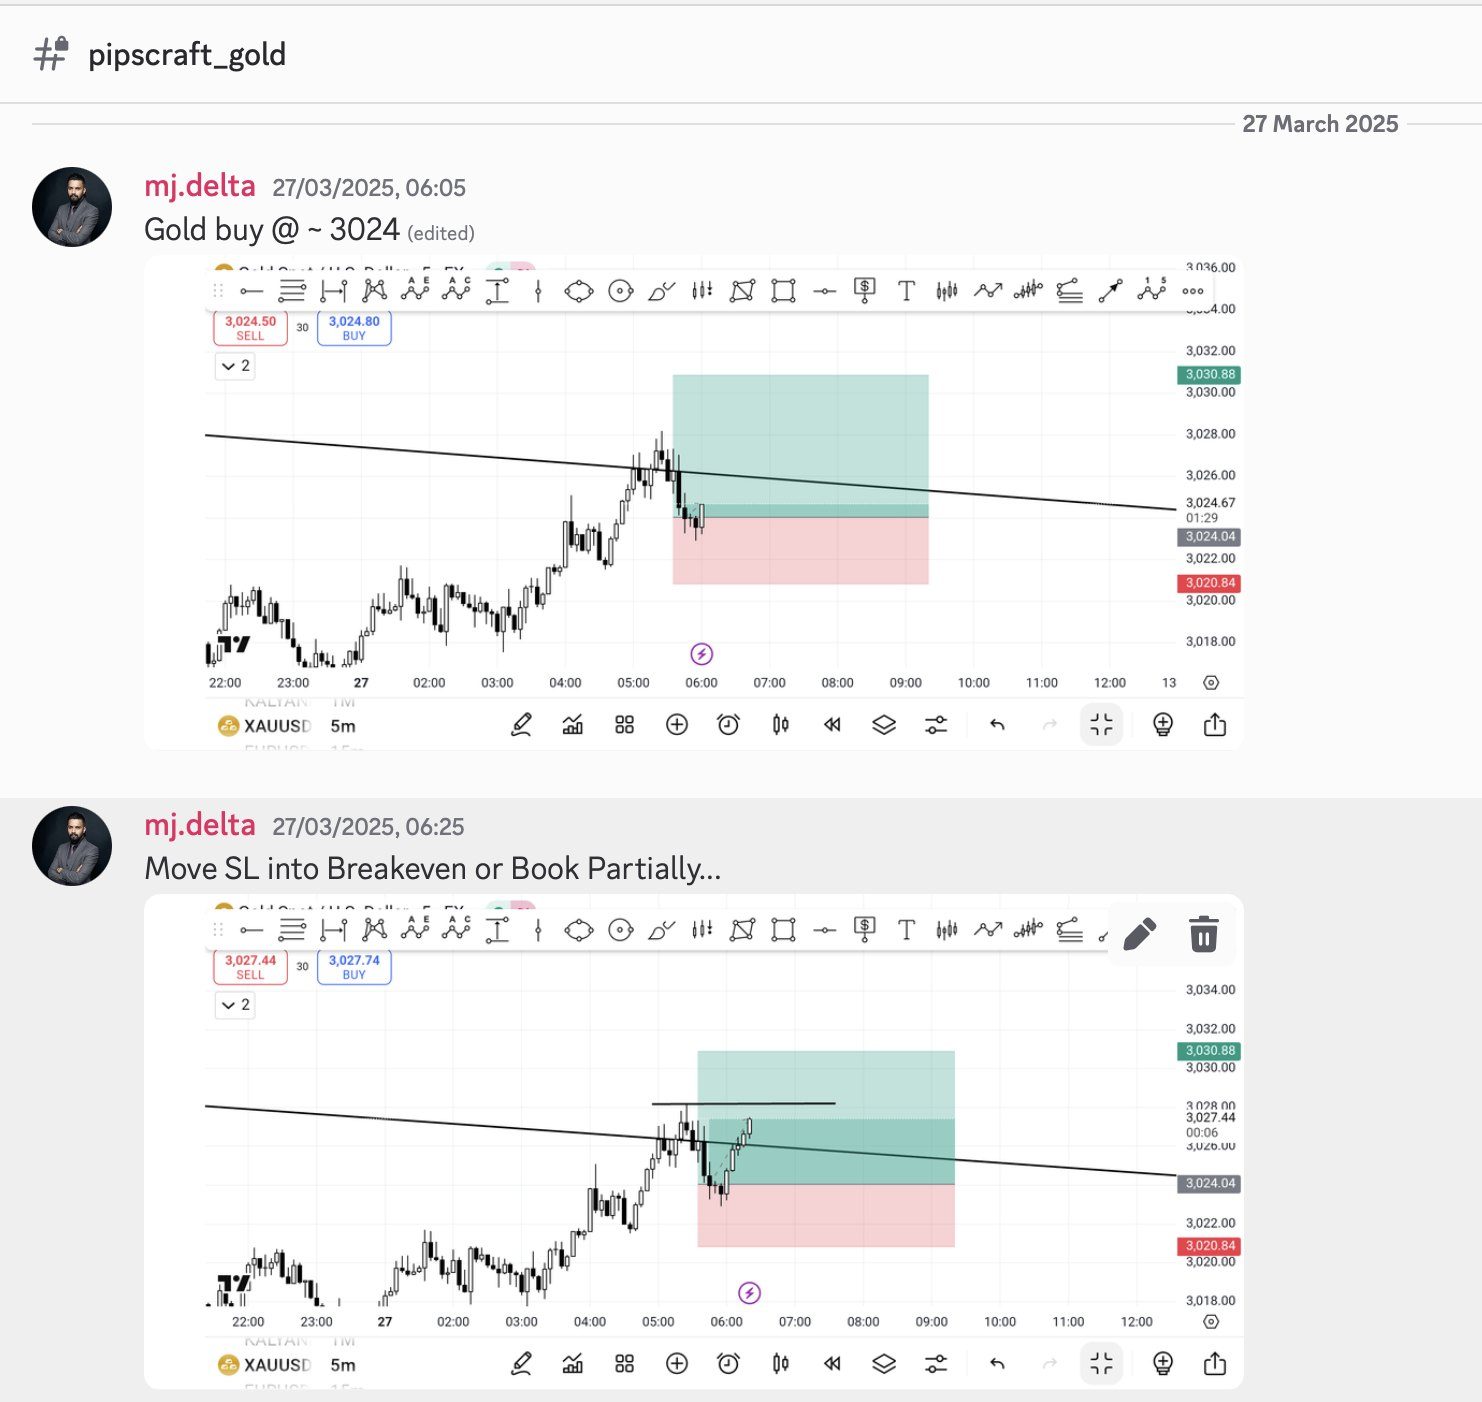
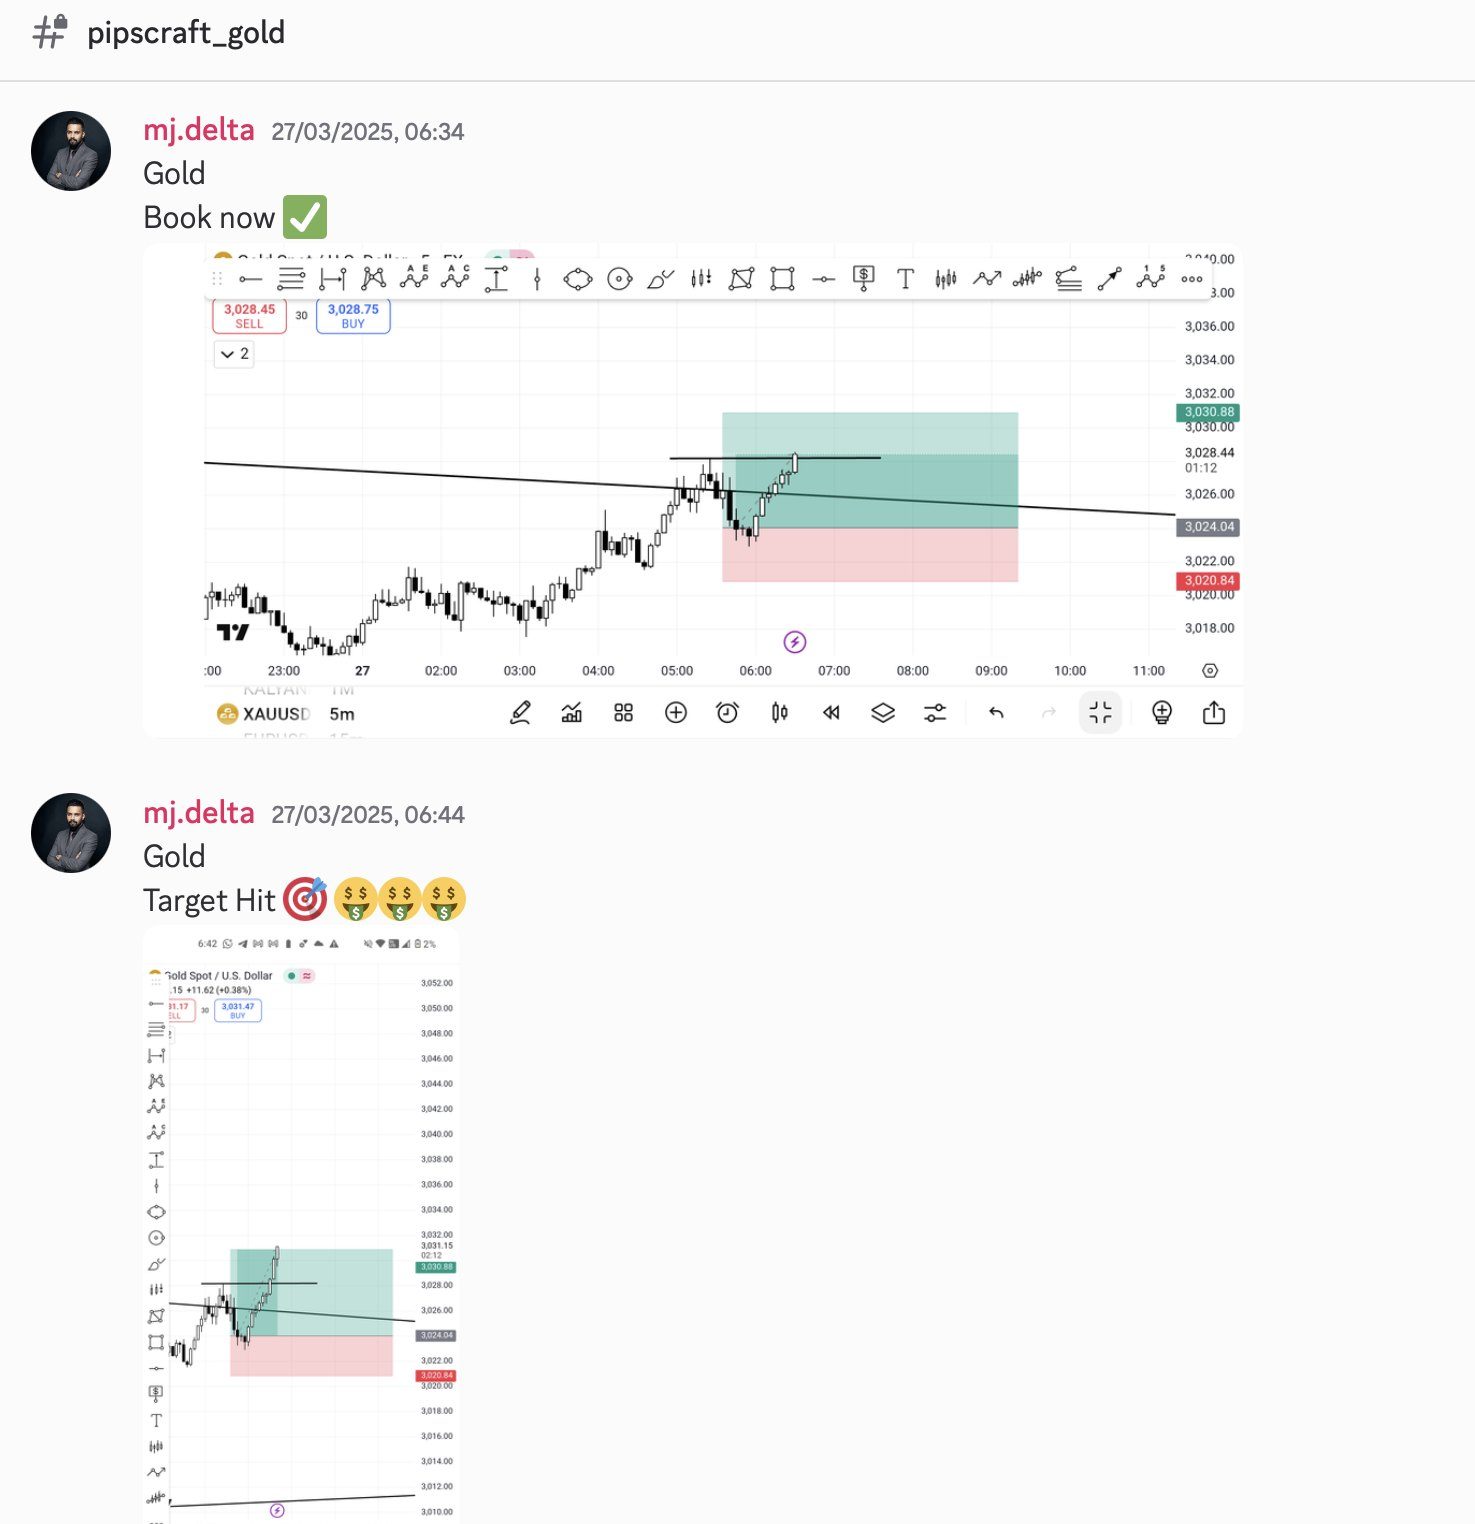
4. Gold Intraday: 39 Minutes, Start to Finish
Entry 06:05. Stop to breakeven 06:25. Booked 06:34. Target hit 06:44.
1 : 2.2 Target hit in 39 min
Why it worked
A clean break-and-retest of the falling trendline during the Asian session. A small stop under the retest, double the reward above it.
What happened
Price retested, held, and ran. Members secured breakeven at 06:25 and booked at 06:34. The target was tagged ten minutes later.
5. Nasdaq: Buying Fear the Night Before the Rip
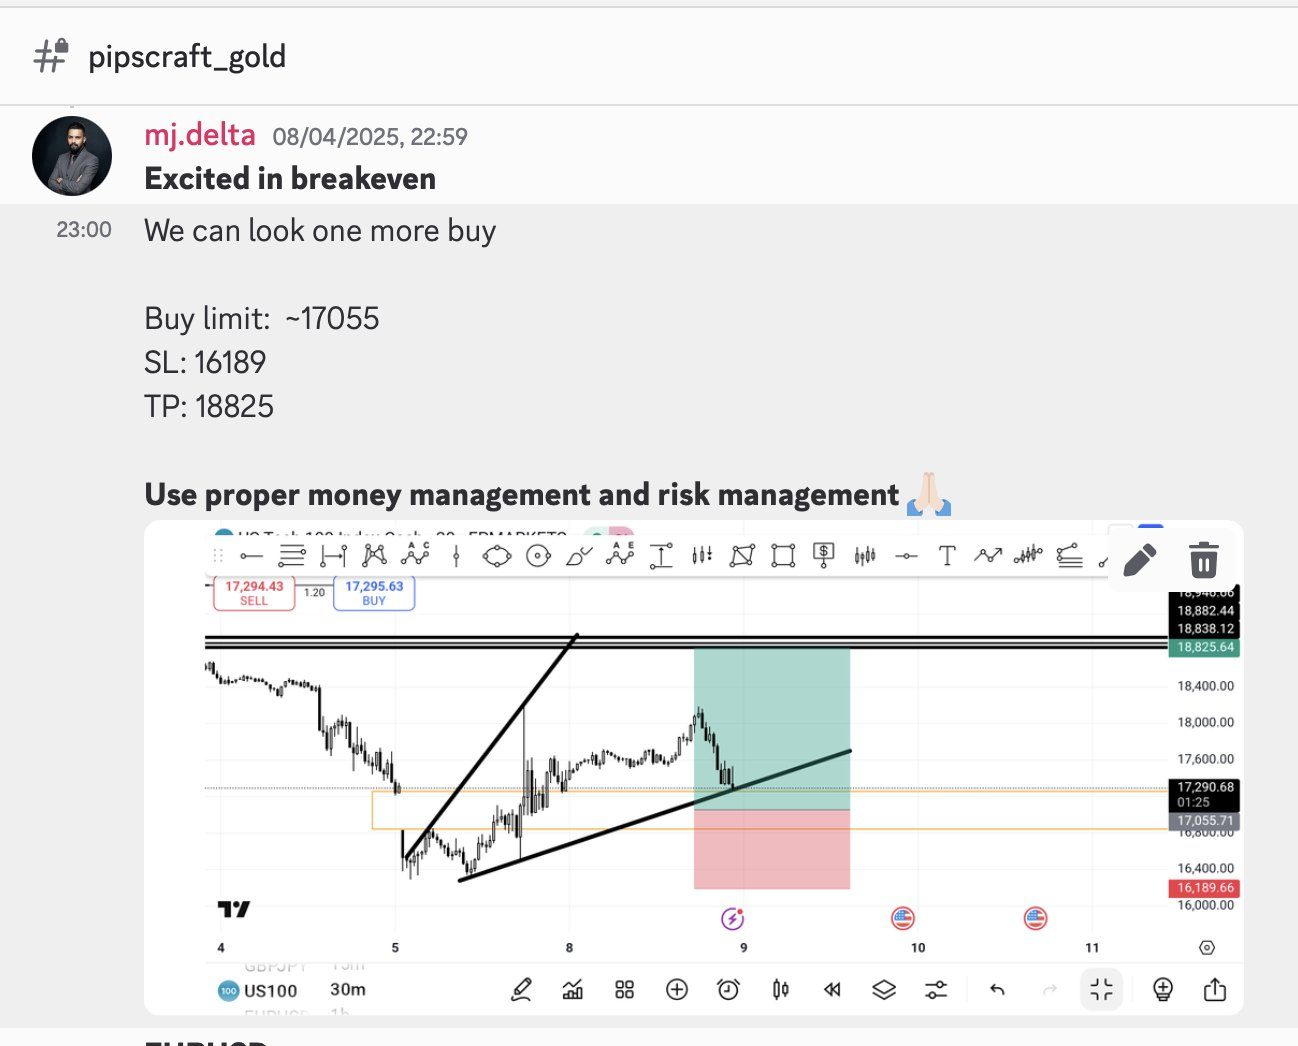
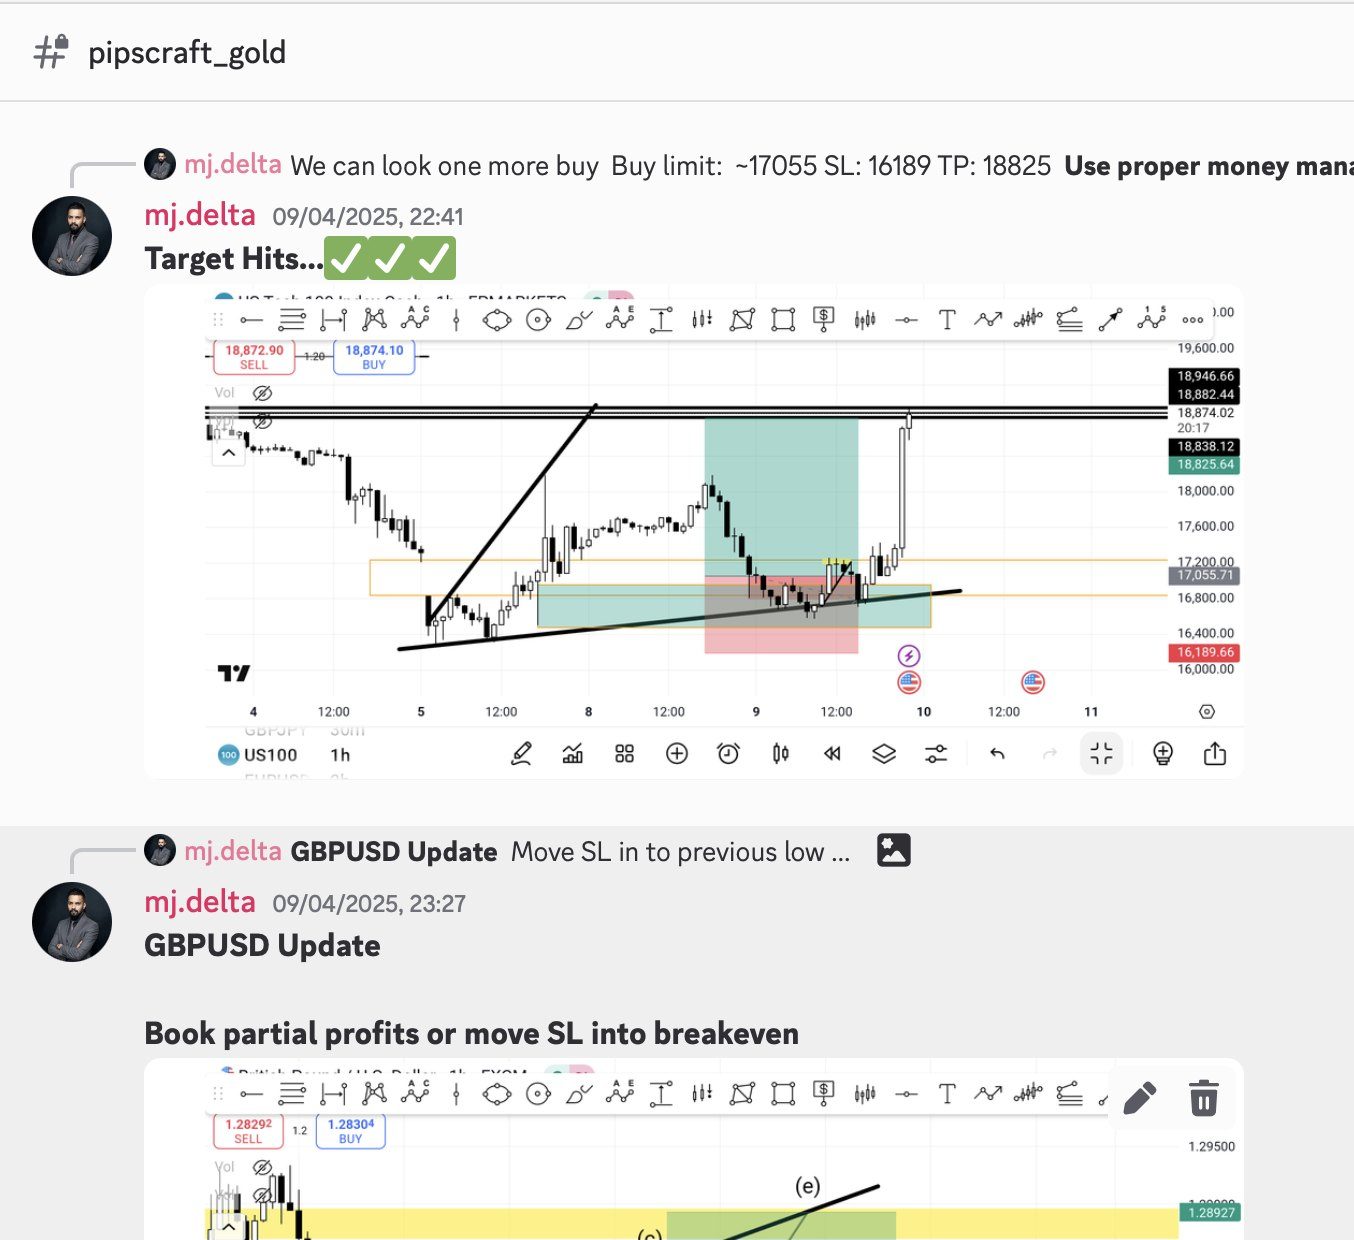
8 April 2025. Markets in tariff panic. We placed a buy limit. 24 hours later, US100 exploded.
+1,770 pts Target hit in under 24 hrs
Why it worked
The first buy was already safe at breakeven. Price came back to the demand zone sitting on the rising trendline from the 7 Apr low: a higher low forming inside the panic.
What happened
On 9 Apr the US announced a 90-day tariff pause. Nasdaq ripped through 18,825 and “Target Hits” went out at 22:41 the same night.
6. EURGBP Part 1: Selling the Top of Wave 3
One wave count, two trades. First, short the exhaustion before the correction.
+74 pips Stop locked in profit · 9 days
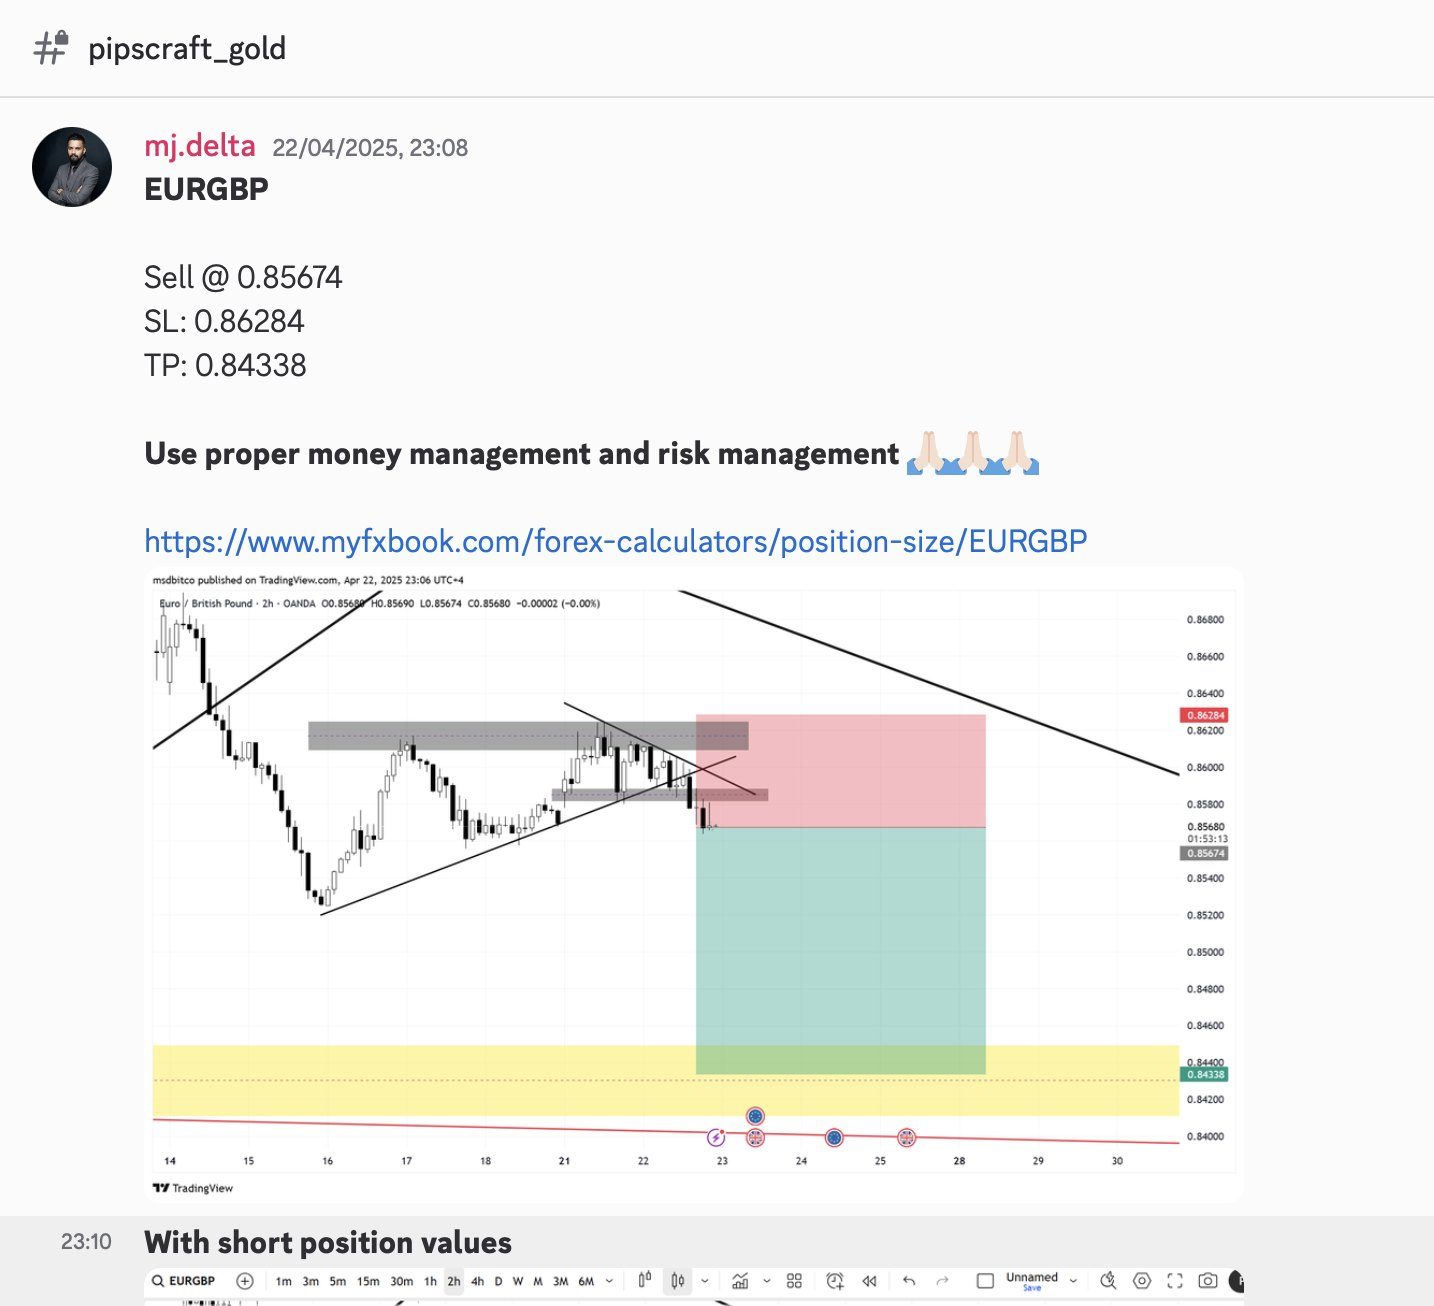
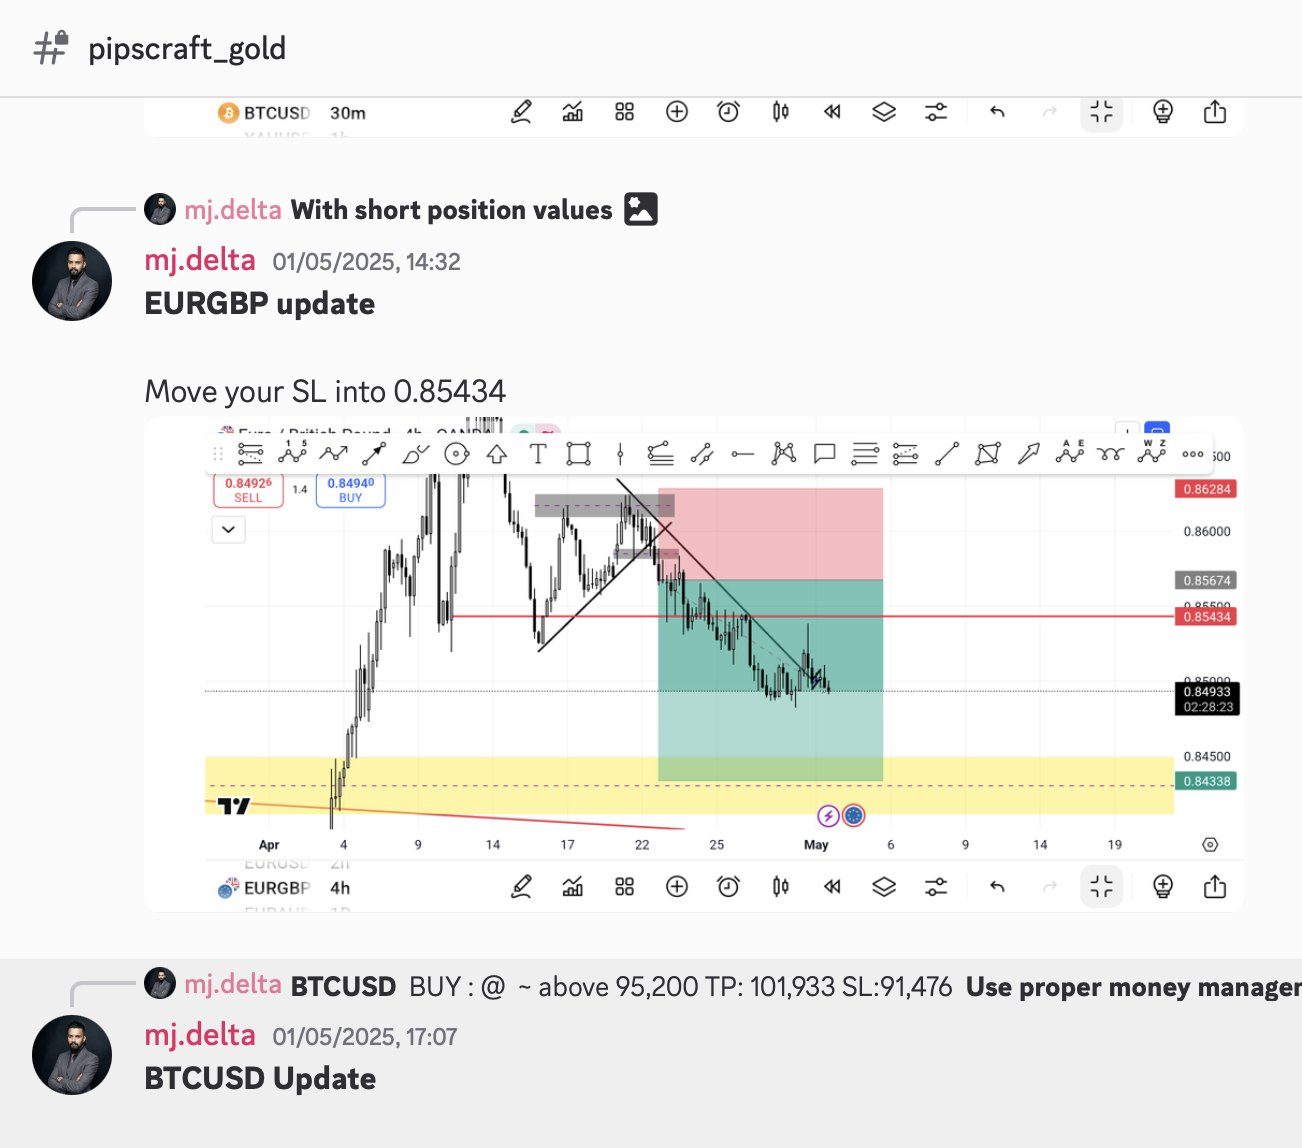
Why it worked
Price broke its rising wedge under a stack of supply zones. In Elliott terms, wave (3) was complete, so the market owed us a wave (4) pull-back.
What happened
EURGBP slid to 0.8493 by 1 May. Members moved the stop to 0.85434, locking profit on a trade that could no longer lose.
7. EURGBP Part 2: Buying the Bottom of Wave 4
The same wave count told us where the pull-back would end: 0.84227.
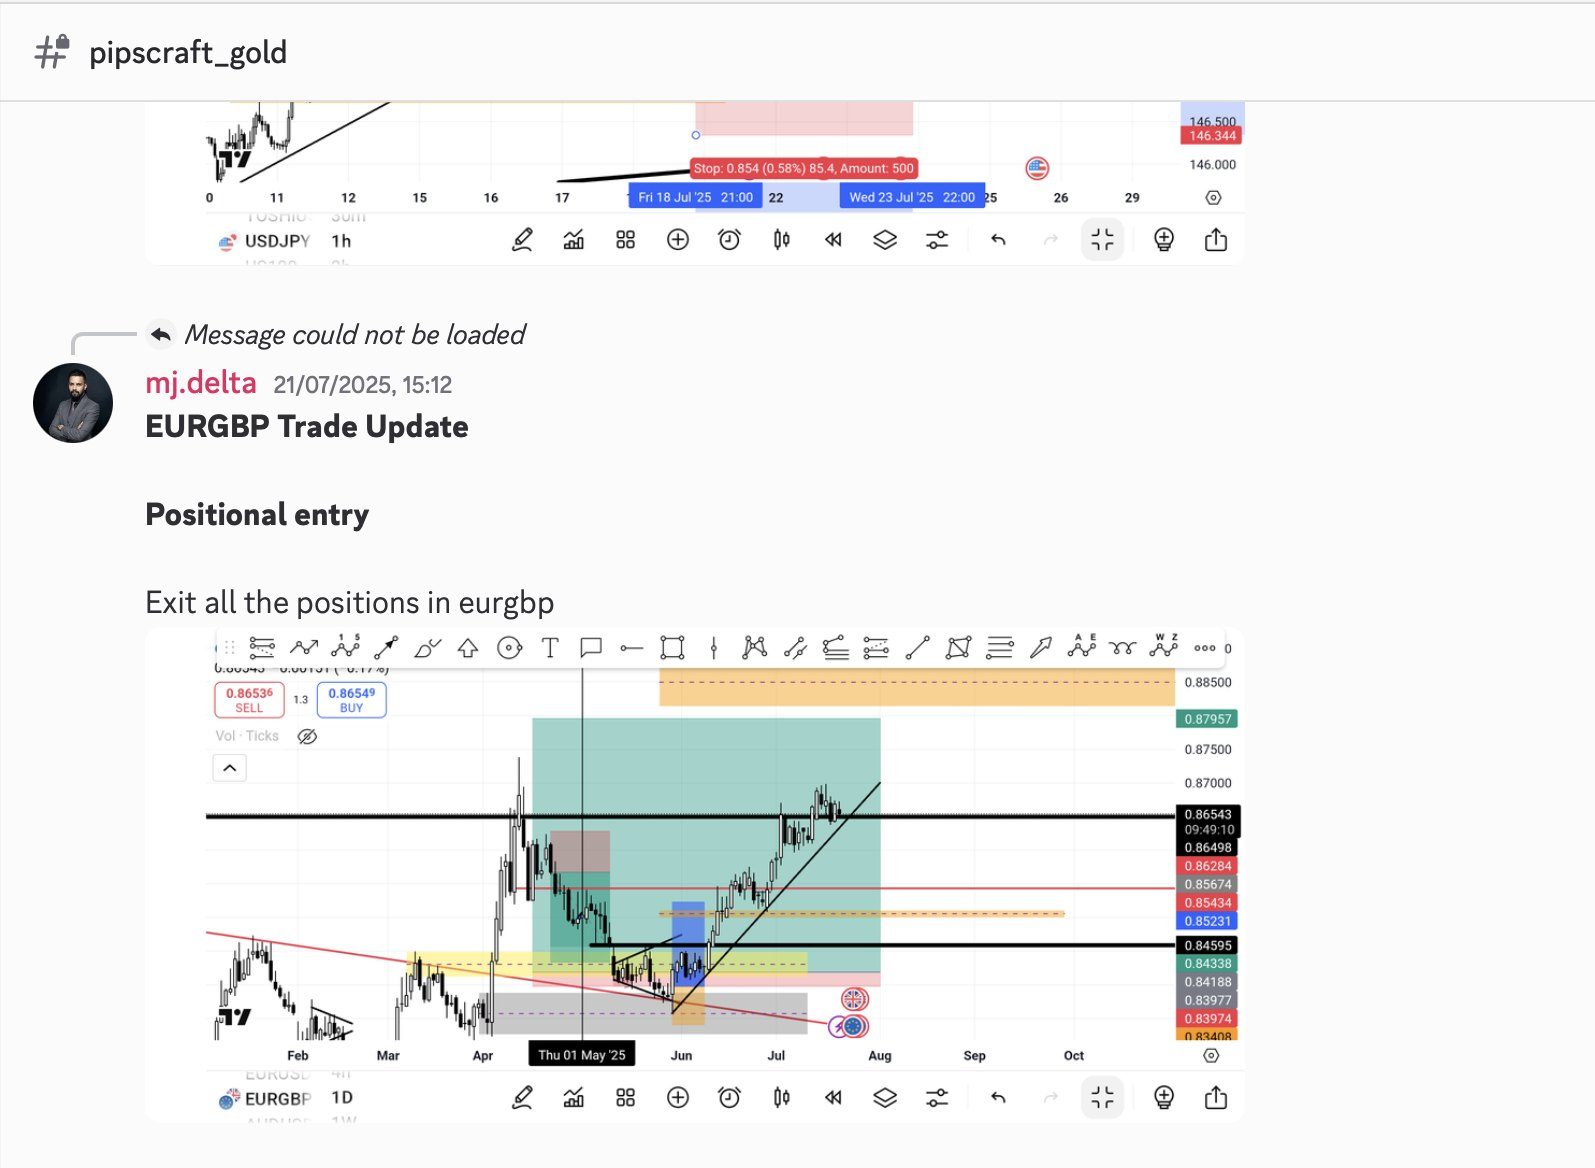
+231 pips Swing · ~3 months
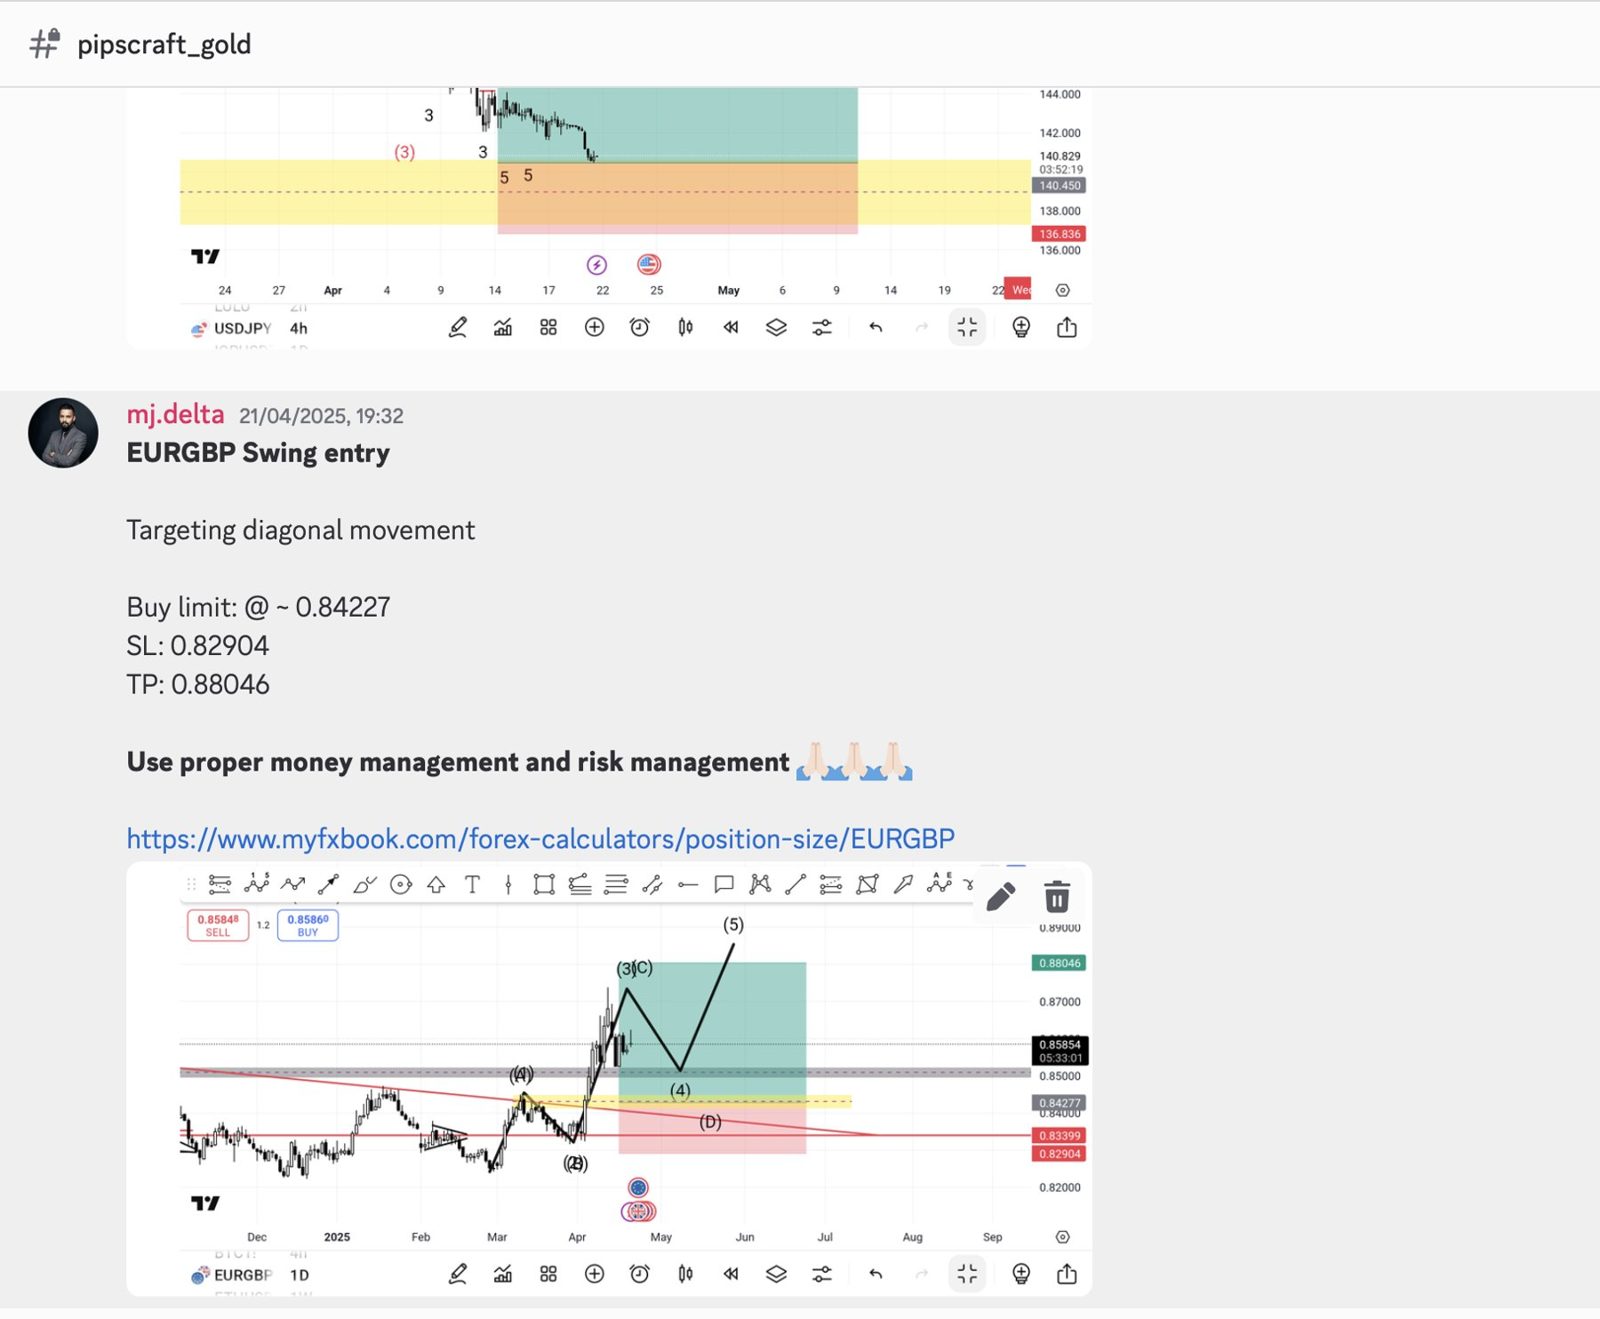
Why it worked
Wave (4) usually returns to the old breakout. 0.84227 was the retest of a broken multi-month trendline plus a fresh demand zone: the textbook wave-4 floor.
What happened
Price reached our level on 6 May, built a base, then launched wave (5). Partials booked 3 Jul; full exit near 0.8654 on 21 Jul.
8. Gold: Patience at $3,389 Paid $189
A sell limit set a week in advance, plus a reminder: “Don’t directly go for the entry.”
+189 pts 1 : 2.6 · Target done
Why it worked
3,379–3,400 was the level gold broke down from on 22 Apr. Broken support becomes resistance (MSNR), and resting liquidity sat just above it.
What happened
Gold rallied straight into our zone on 6 May, stalled, and reversed. “Target done” was posted on 14 May with gold at $3,179.
9. Bitcoin: The Sweep, the Reclaim, the Target
One sharp wick flushed the weak hands and handed us the entry of the week.
+1,698 Target hit in 16 hrs
Why it worked
Price spiked into the yellow demand zone, swept the lows, and instantly reclaimed the blue order block. A liquidity grab inside a triangle: the classic trap before the real move.
What happened
BTC climbed through the triangle’s upper trendline overnight. “BTC target hits” went out at 13:57 the next afternoon.
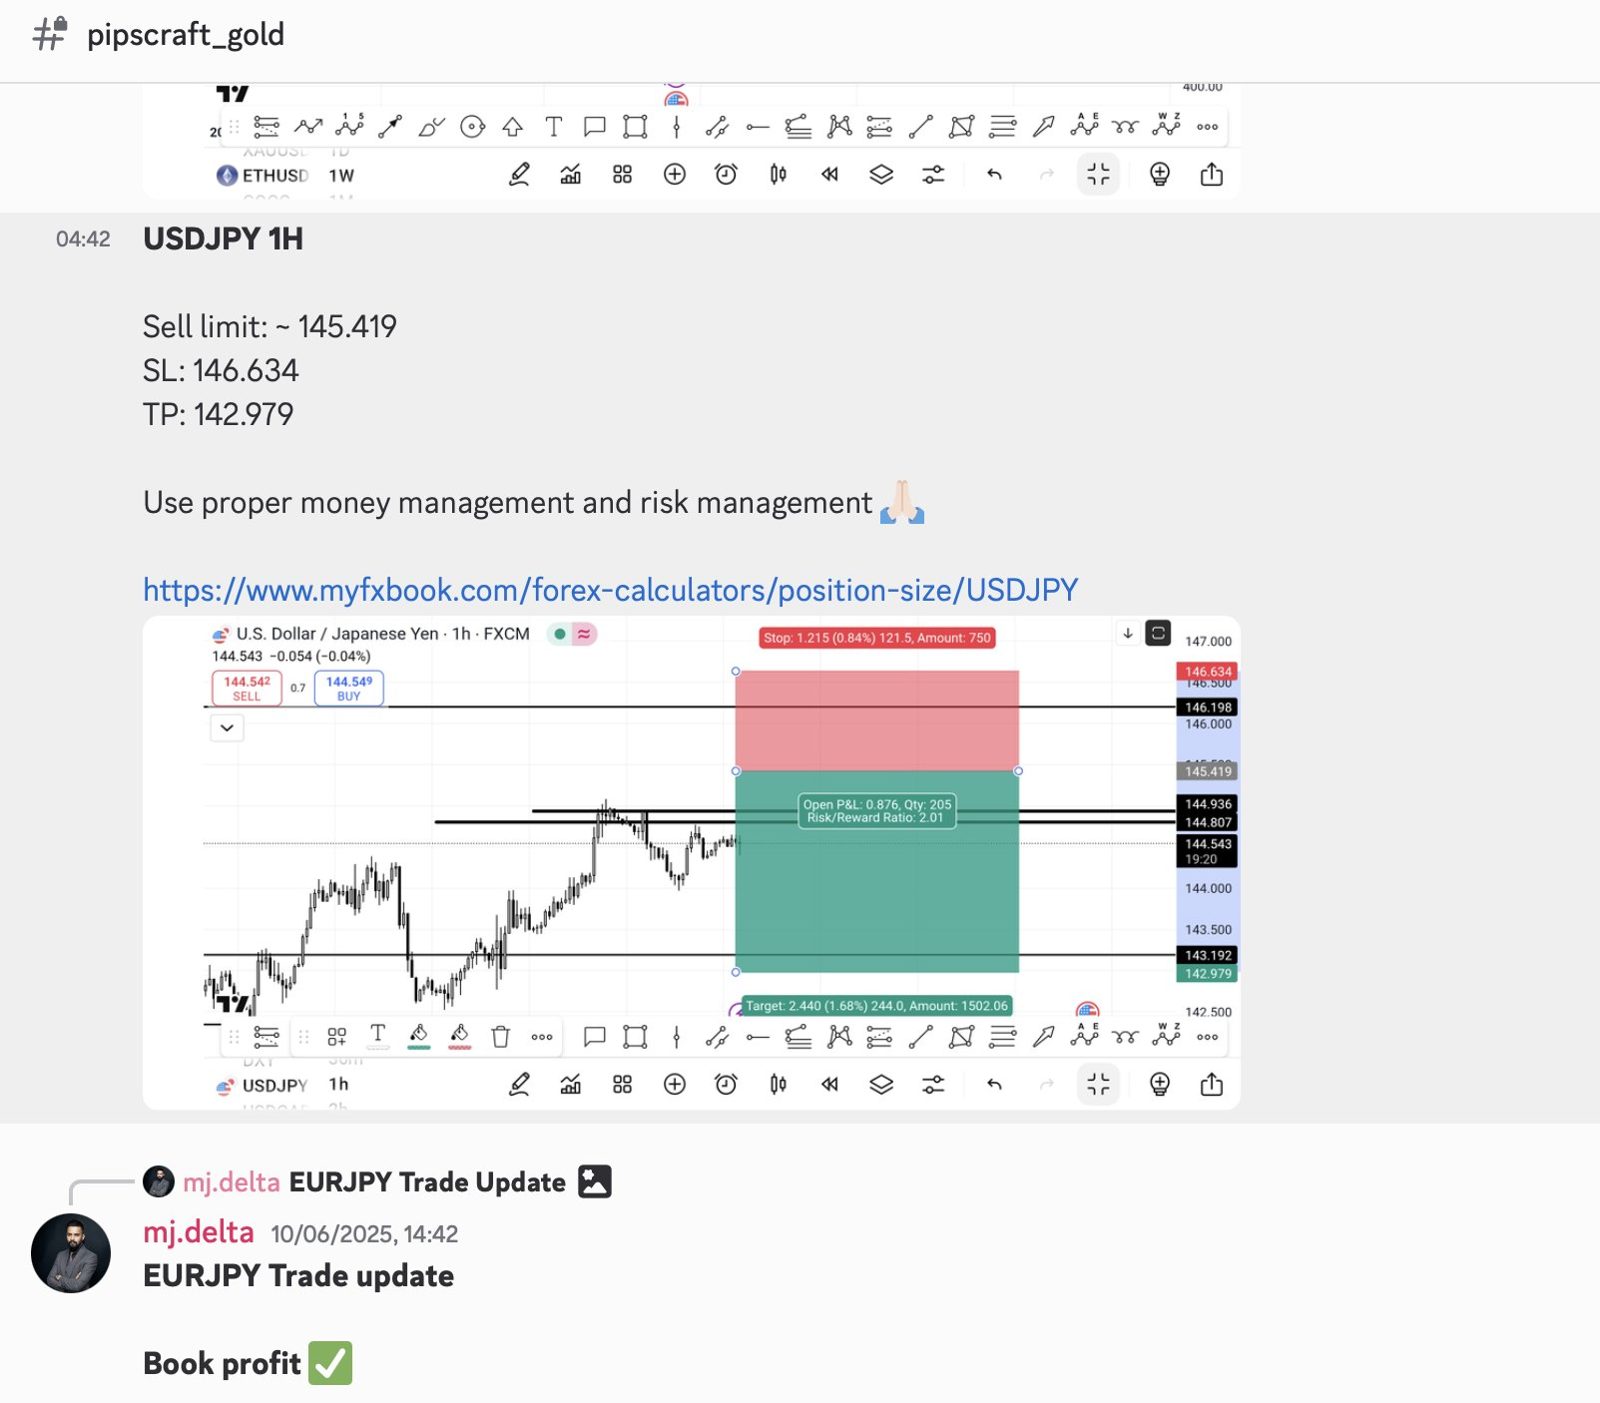
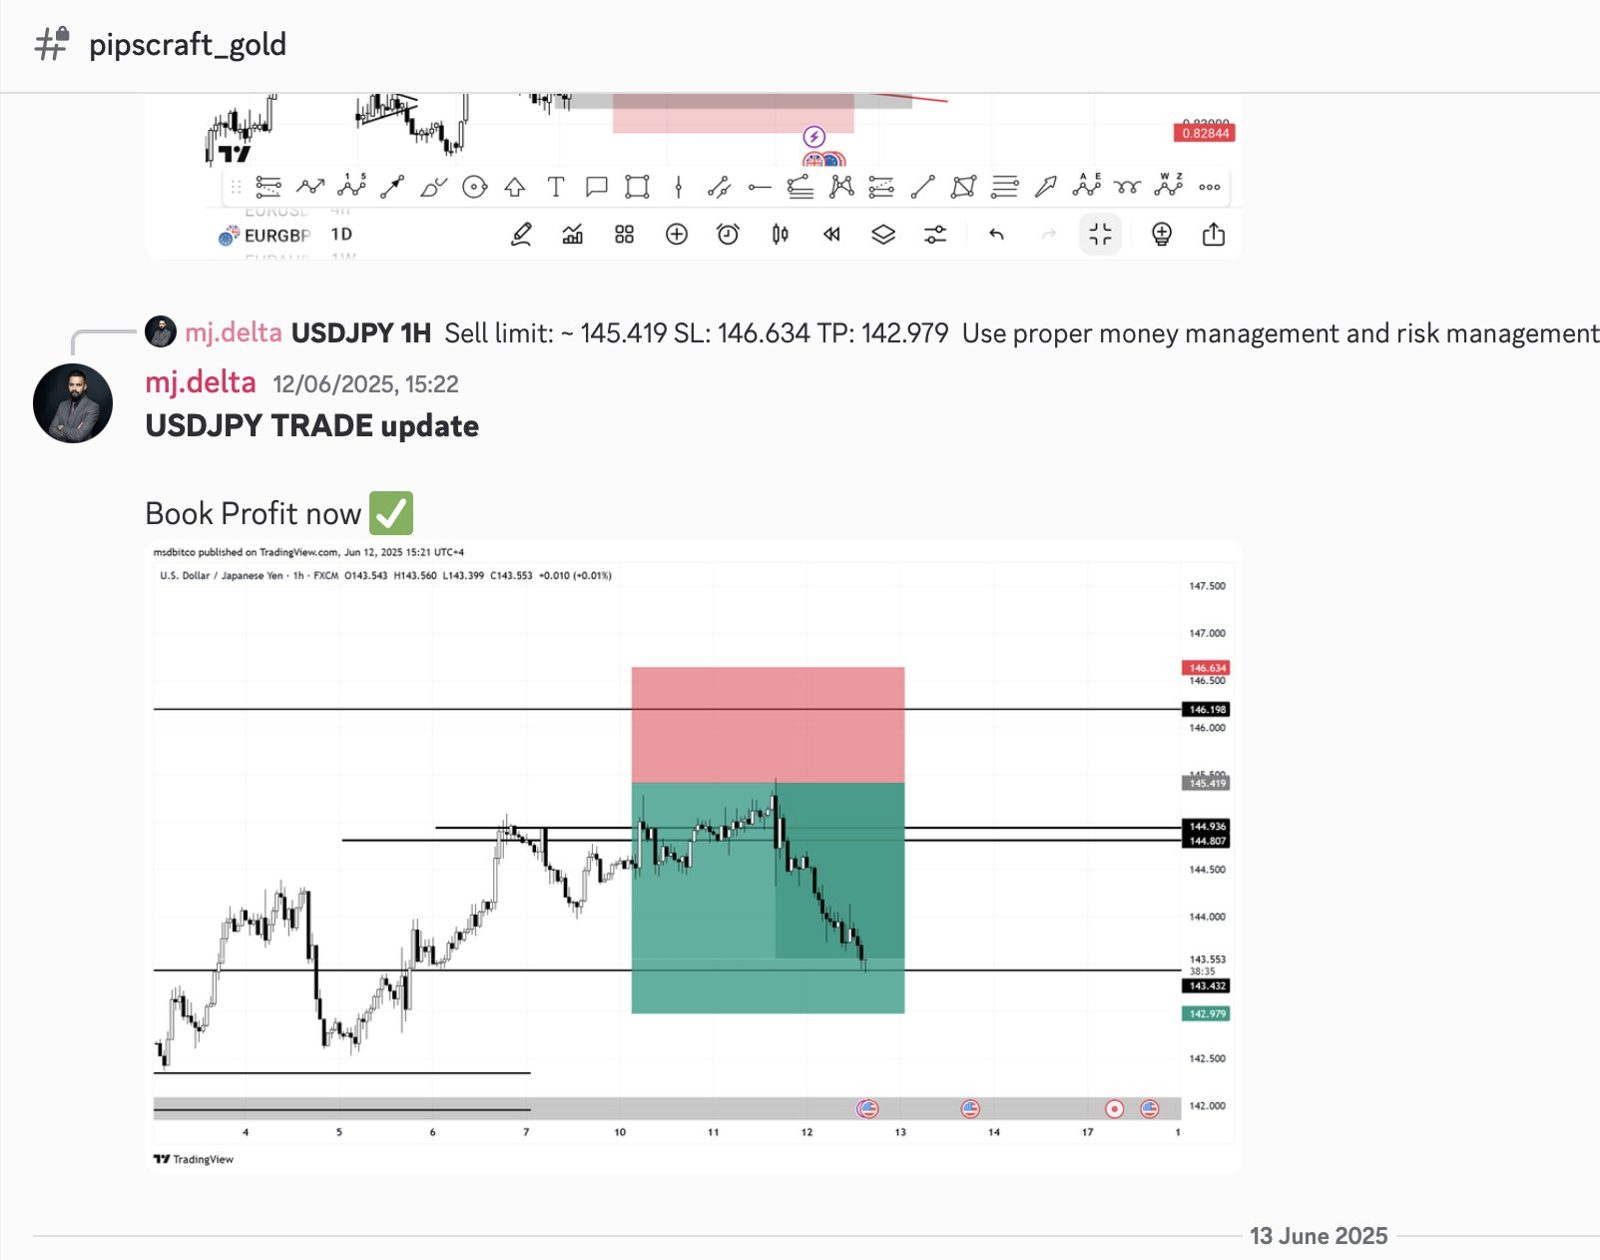
10. USDJPY: Selling the Stop-Hunt
We didn’t sell the double top. We sold where breakout buyers would get trapped.
+187 pips Booked in 2 days
Why it worked
Equal highs at 144.8–144.9 are a magnet for stop orders. Our sell sat above them, so the stop-hunt itself became our entry.
What happened
Price spiked into the order, swept the highs, then dropped. Profit was booked at 143.55 on 12 Jun.
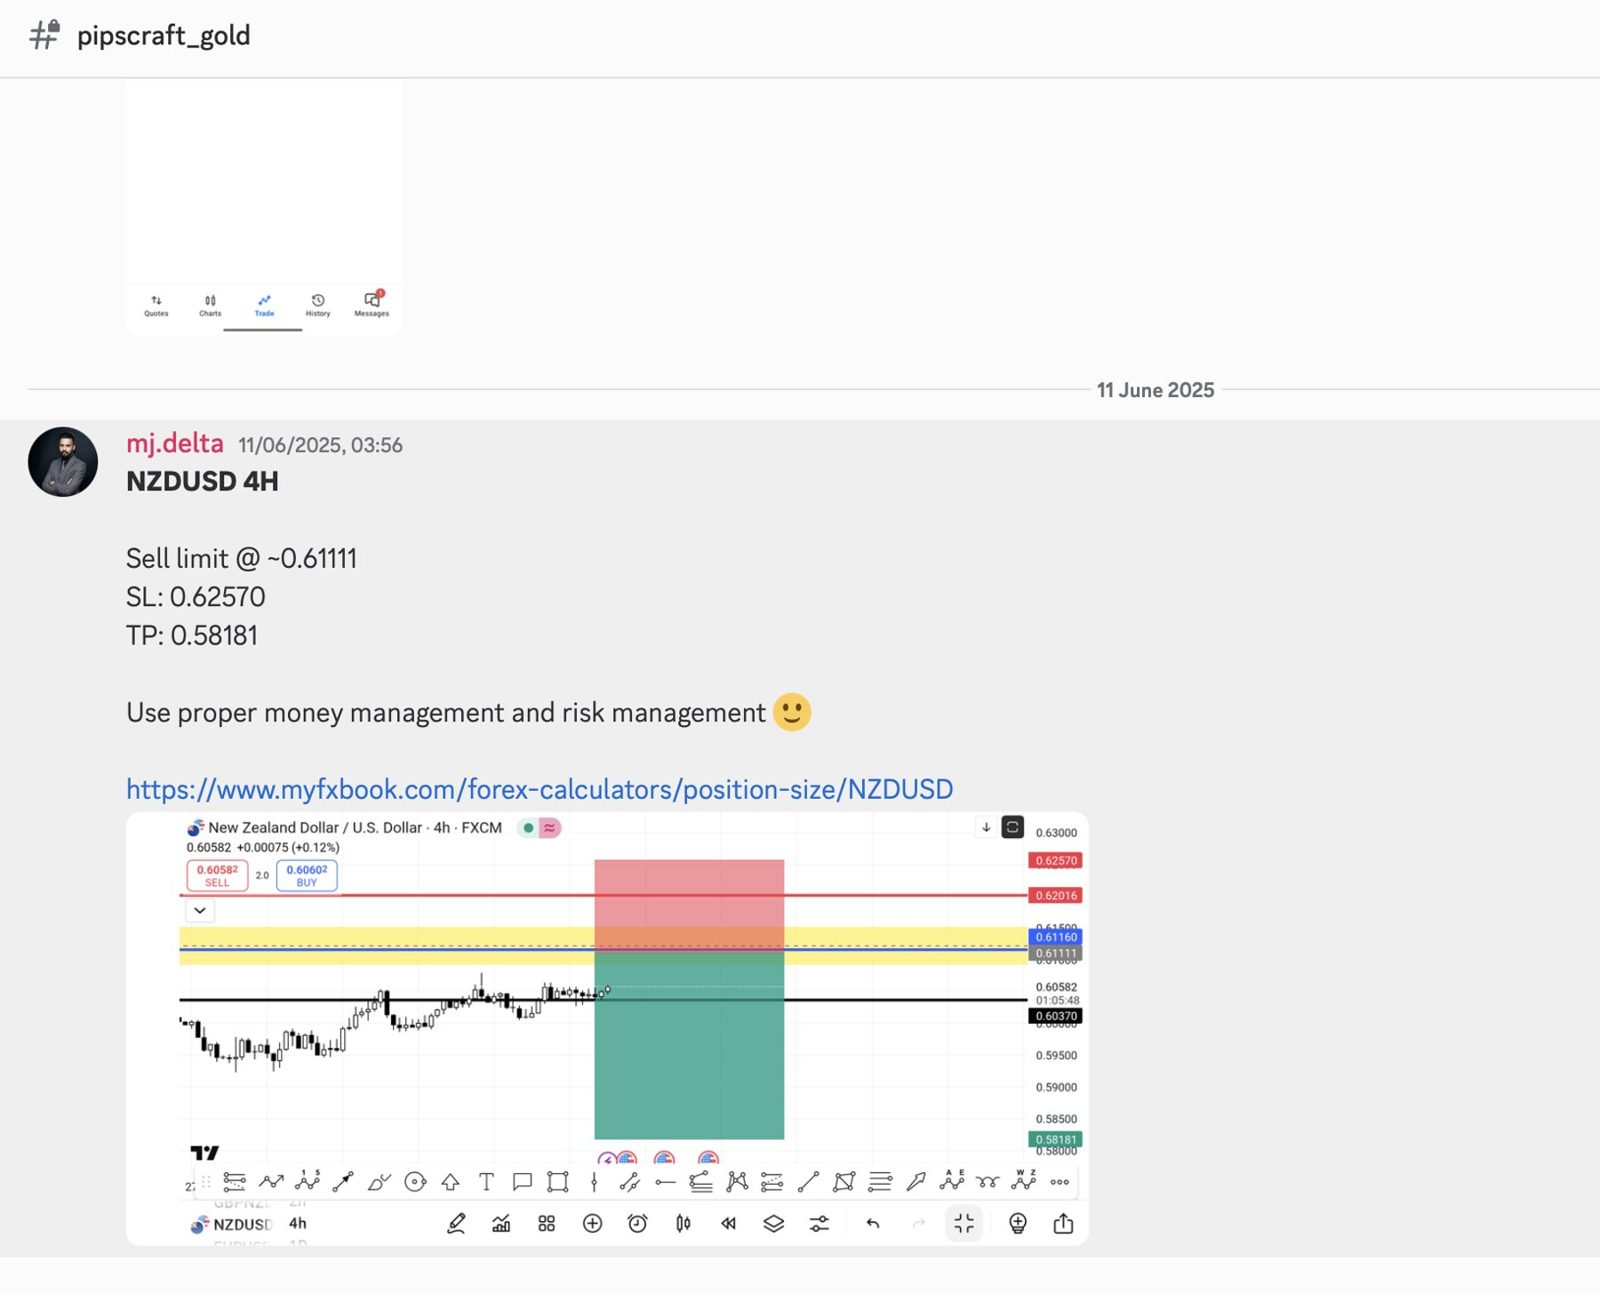
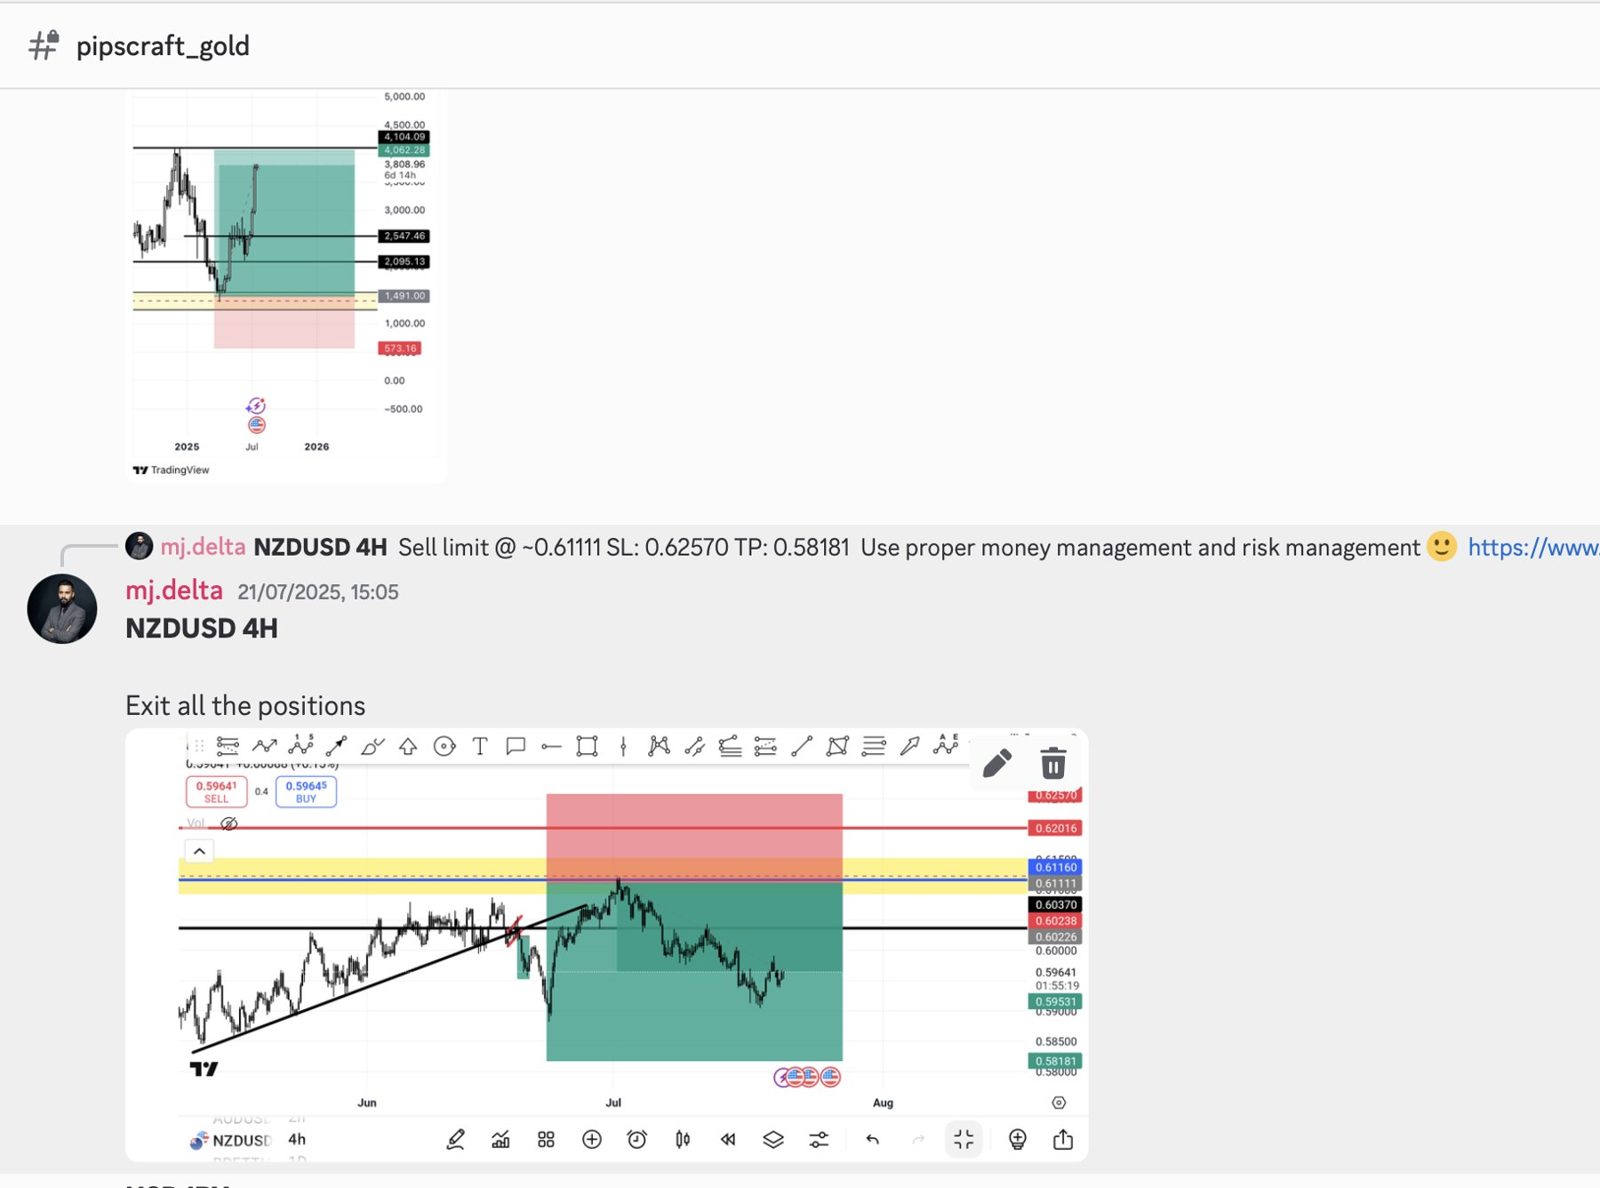
11. NZDUSD: The Order That Waited 3 Weeks
Placed 11 June. Filled in early July. Closed in profit on 21 July. Patience is a position.
+147 pips Swing · ~6 weeks
Why it worked
A supply zone at 0.6111–0.6116 sat above a rising trendline that was running out of steam. We marked where sellers would return and let price come to us.
What happened
The trendline broke, price spiked up into our zone in early July, then turned lower. All positions were closed near 0.5964 on 21 Jul.
2026: trading in public, in real time
In 2026 the calls moved into the open: wave maps posted in the WhatsApp Live Trading Room, and FOMC trades taken live on YouTube with the chart and the chat on screen.
| Posted | Market | Call | Entry | Result | Time |
|---|---|---|---|---|---|
| 16 Sep | XAUUSD | Sell · FOMC live | ~4,337 | −27 pts in our favour | Minutes |
| 17 Sep | XAUUSD | Expected wave | 4,340 dip | Path traced, +56 pts | 17 hours |
| 20 Sep | BTCUSD | Level map | 81,238 | +5,316 toward 87,599 | ~2.5 hours |
| 4 Oct | $TRUMP | CHoCH → BOS | 2.03–2.04 | BOS broken as drawn | Next session |
| 26 Aug | XAUUSD | Sell · daily (WXY) | 4,660 | Target, +590 pts | ~2 months |
| 28 Oct | XAUUSD | Buy · FOMC live | ~4,025 | +39 pts | < 30 minutes |
12. FOMC Live: Selling the Fifth Wave
16 Sep 2026: trading the Fed decision live on YouTube, chart and chat on screen.
−27 pts Gold fell our way within minutes
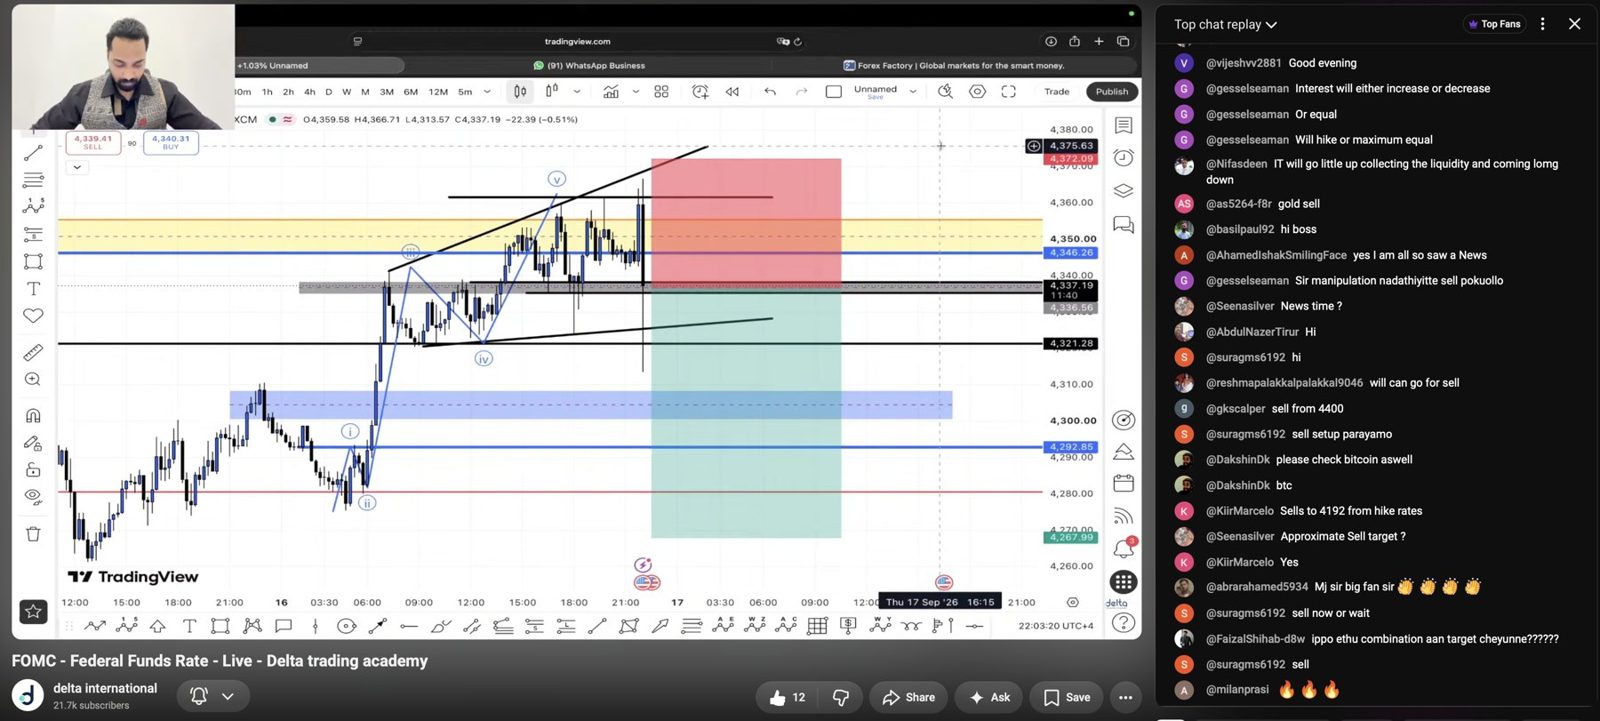
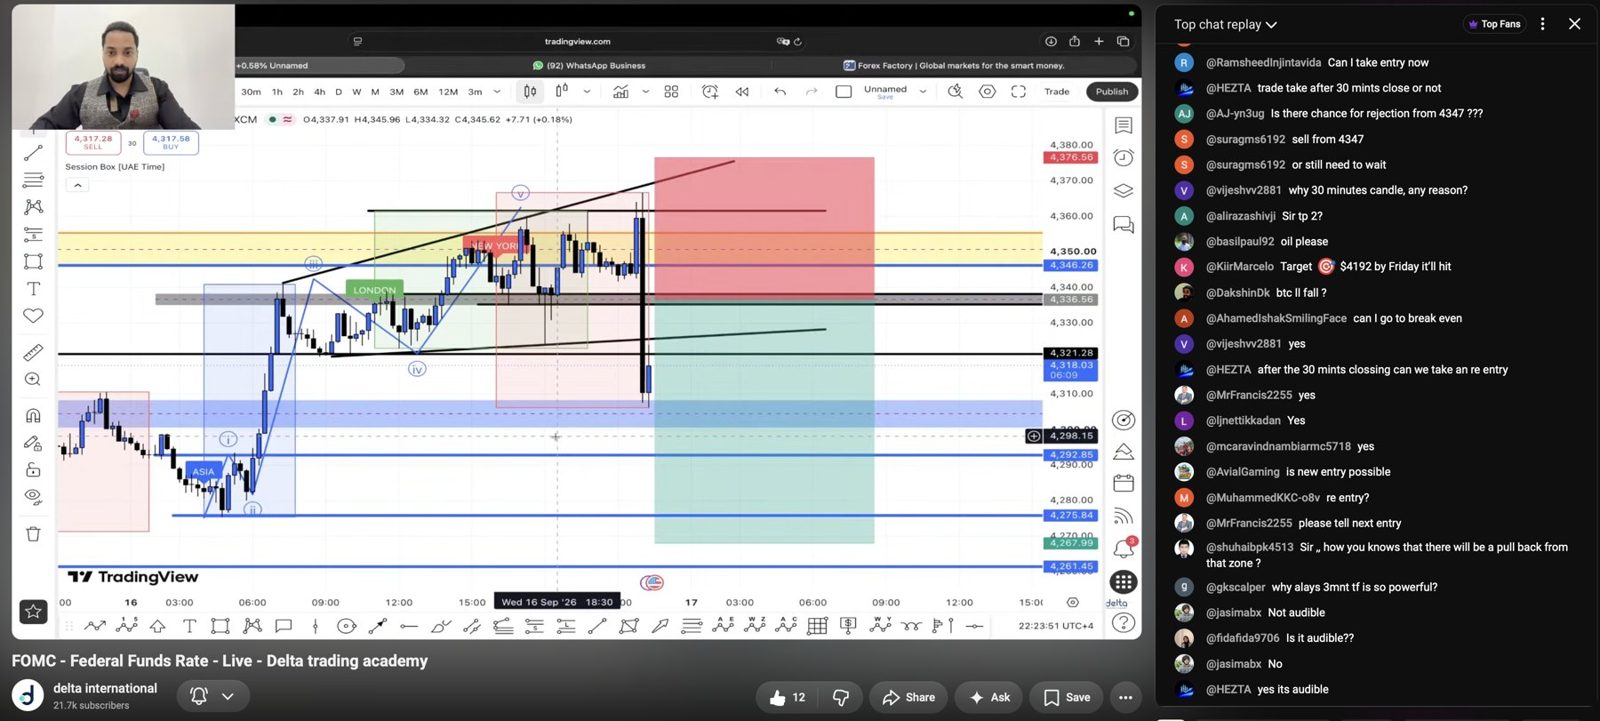
Why it worked
Gold had printed a five-wave (i–v) advance inside a rising wedge, straight into the 4,346–4,355 supply zone. Wave v into supply, right before a high-impact event.
What happened
Moments after the rate decision, gold dropped out of the wedge to ~4,310. The whole move played out live, with the chat calling it in real time.
13. Gold: Drawn on Thursday, Done on Friday
“Expected wave”. One line on a chart. Seventeen hours later, gold had traced it.
+56 pts From the projected dip
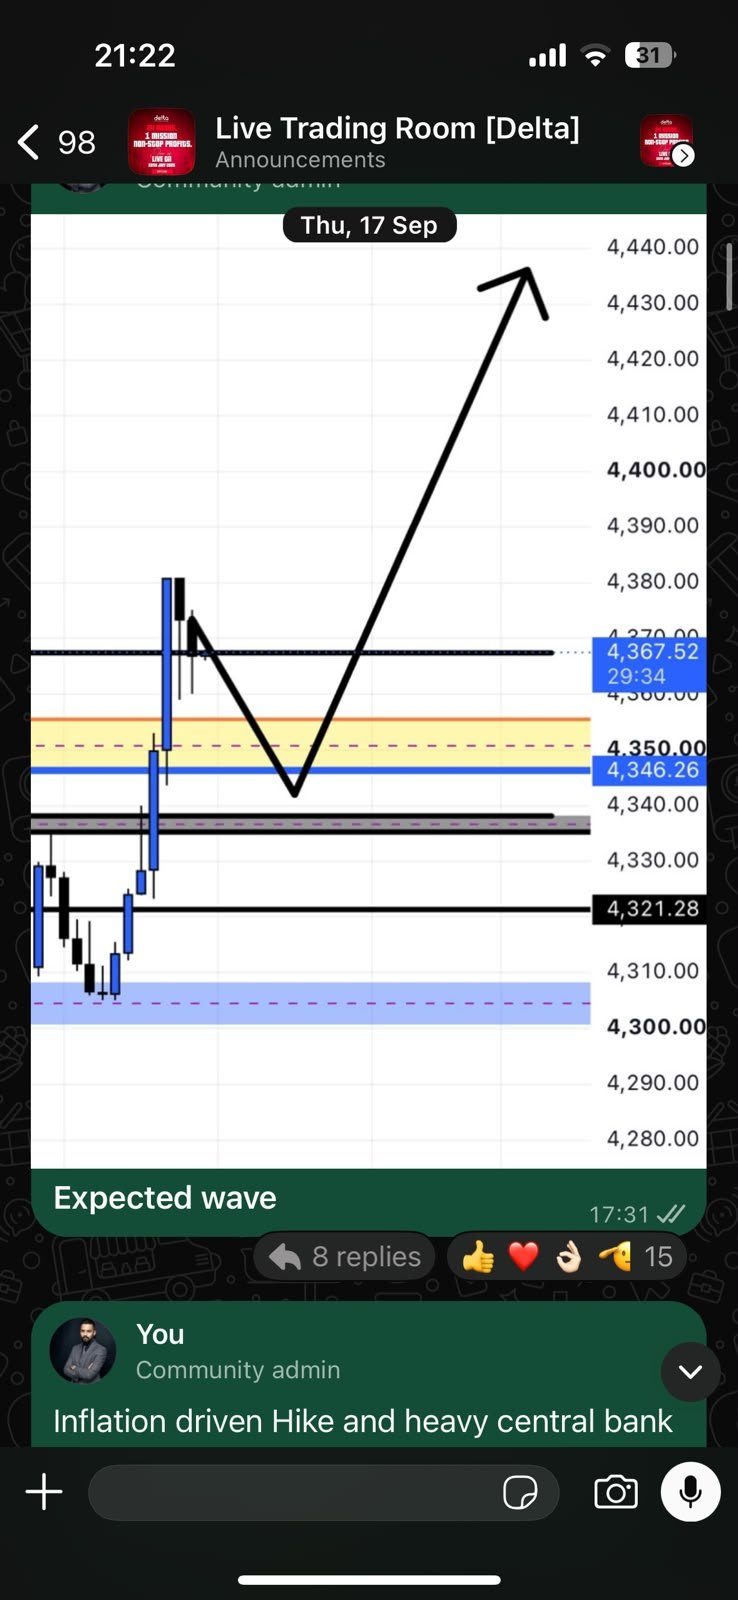
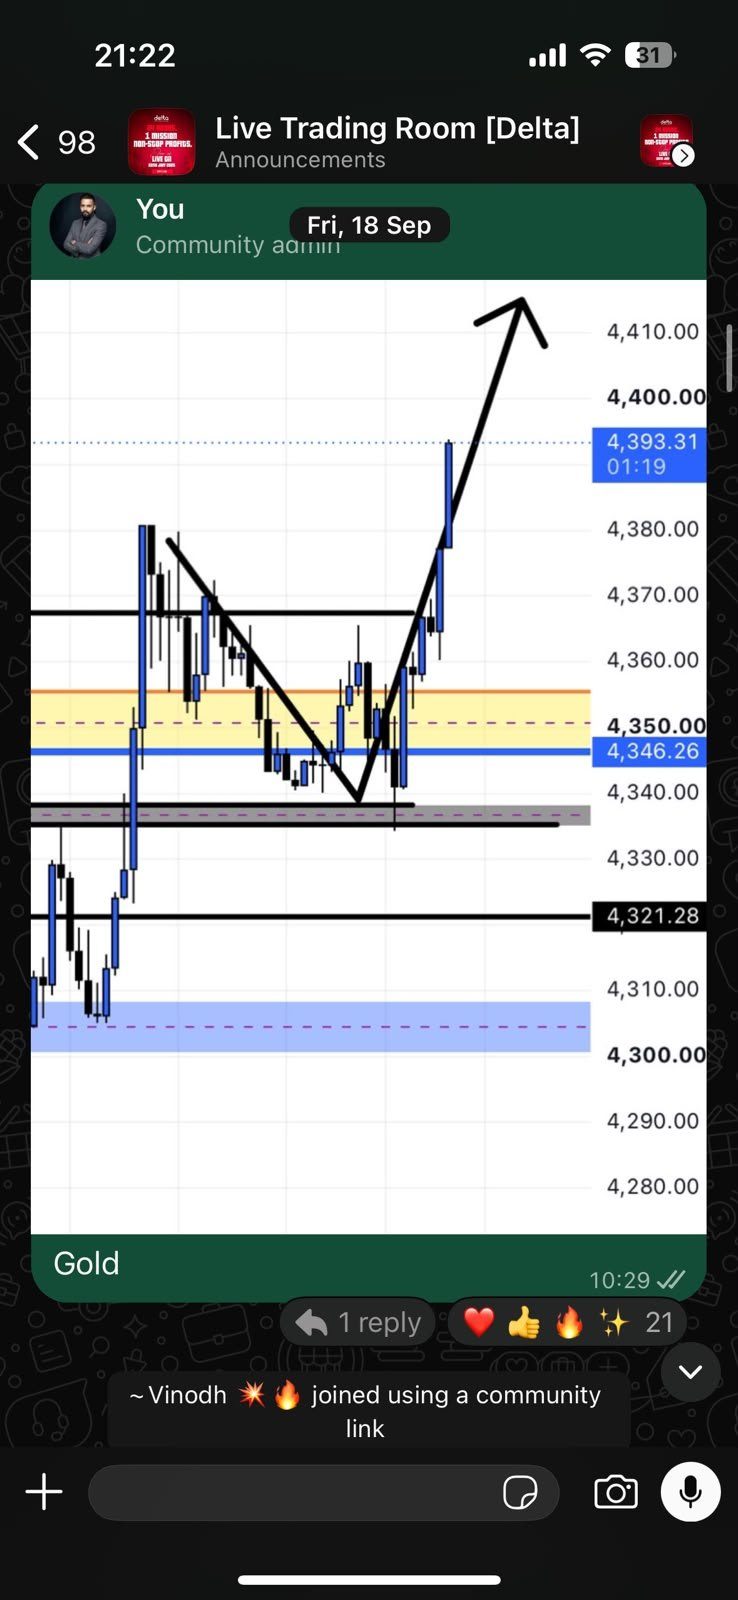
Why it worked
After FOMC, gold needed one more pull-back into the 4,340–4,350 demand zone to collect liquidity before the next leg higher.
What happened
Gold dipped to ~4,338, based right at the zone, then broke out to 4,393 by 10:29 on 18 Sep, tracing the drawn path.
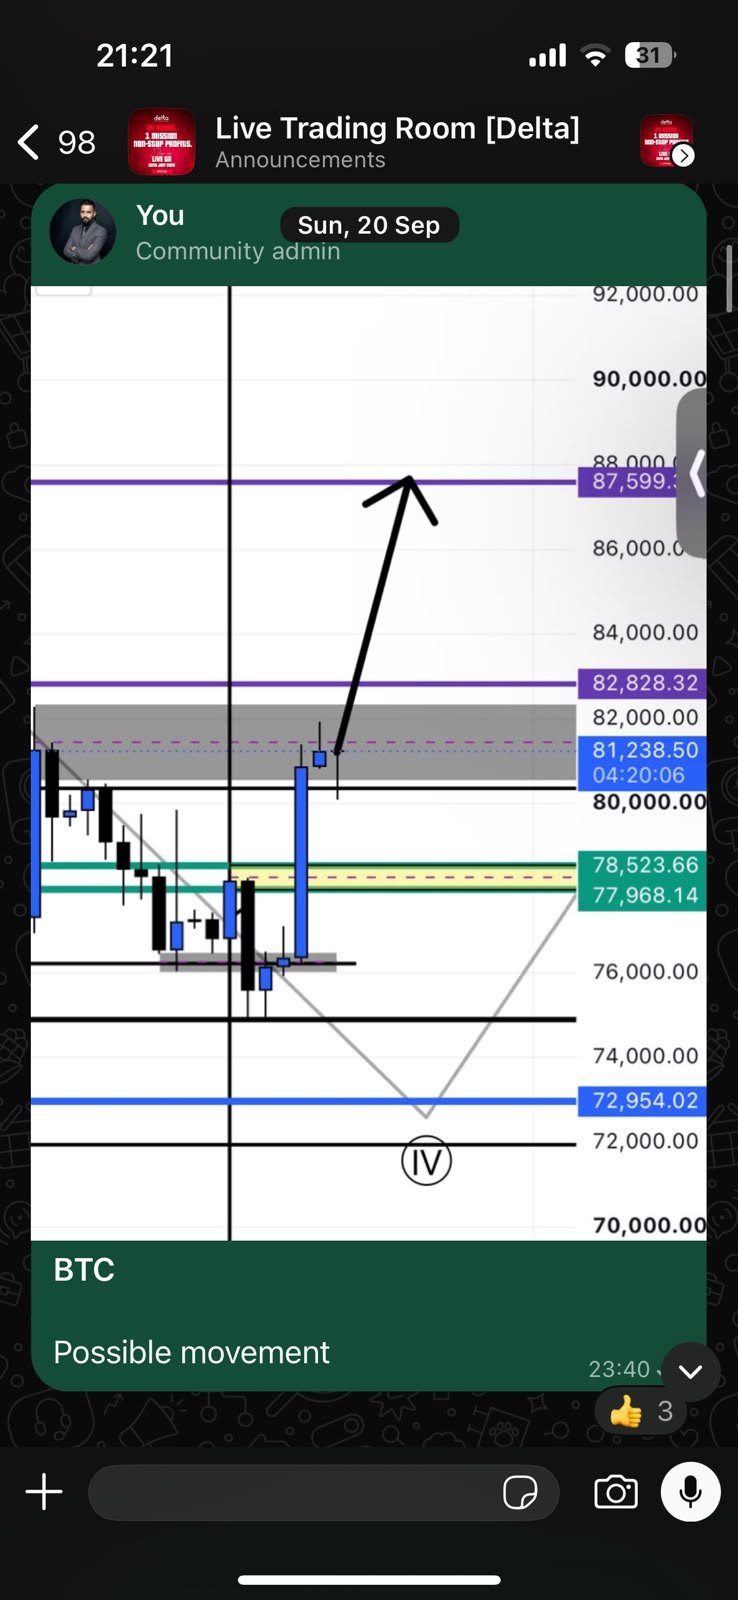
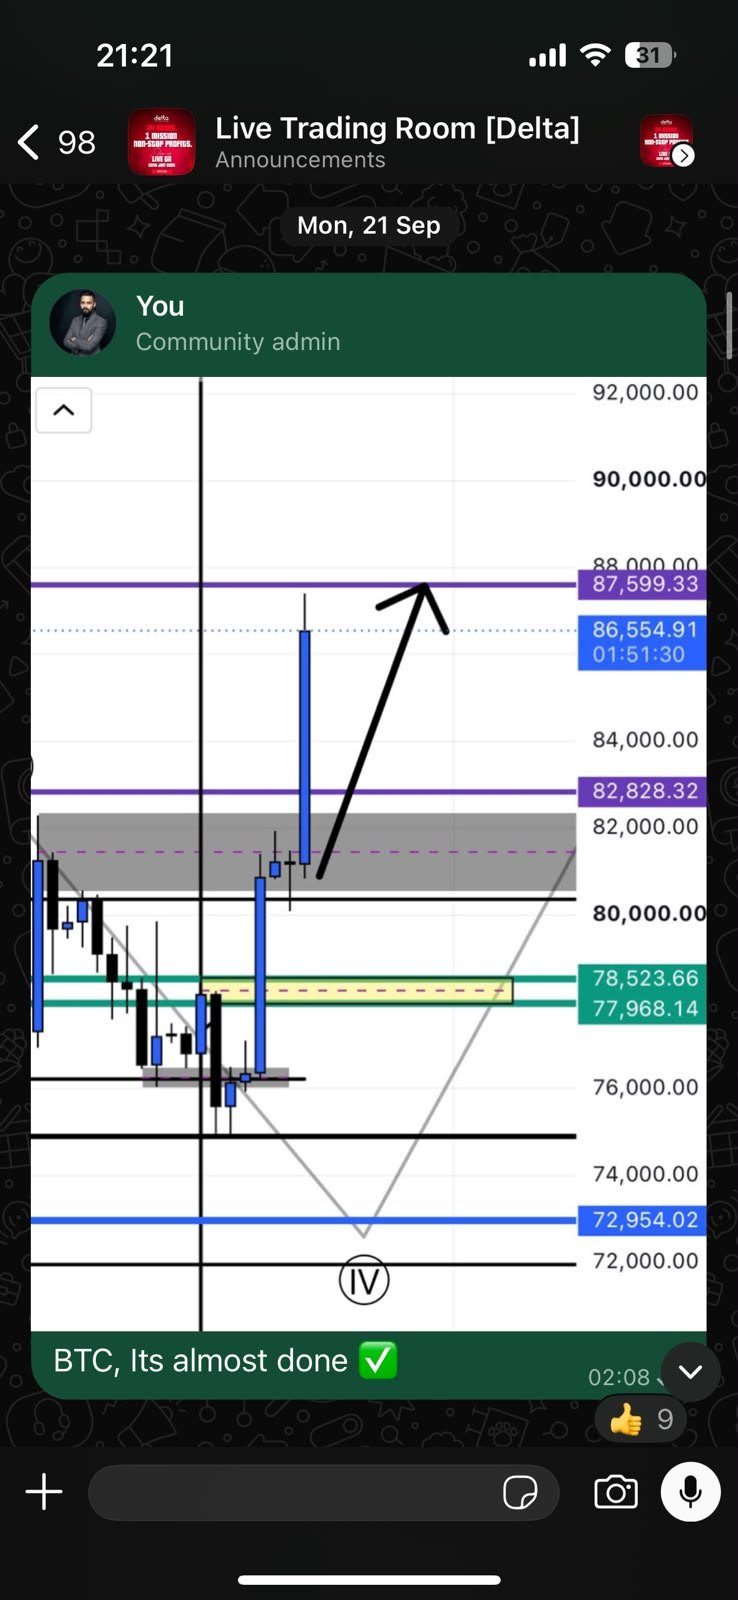
14. Bitcoin: From Map to Move in 2.5 Hours
Posted near midnight. Two and a half hours later, BTC had covered almost the whole path.
+5,316 In about 2.5 hours
Why it worked
BTC had reclaimed the 80–82K block after a liquidity grab near 76K. Our mapped levels put the next magnet at 87,599, with 82,828 as the stepping stone.
What happened
Price sliced through 82,828 and ran to 86,555 by 02:08 on 21 Sep, about 1,000 points shy of the final level within hours.
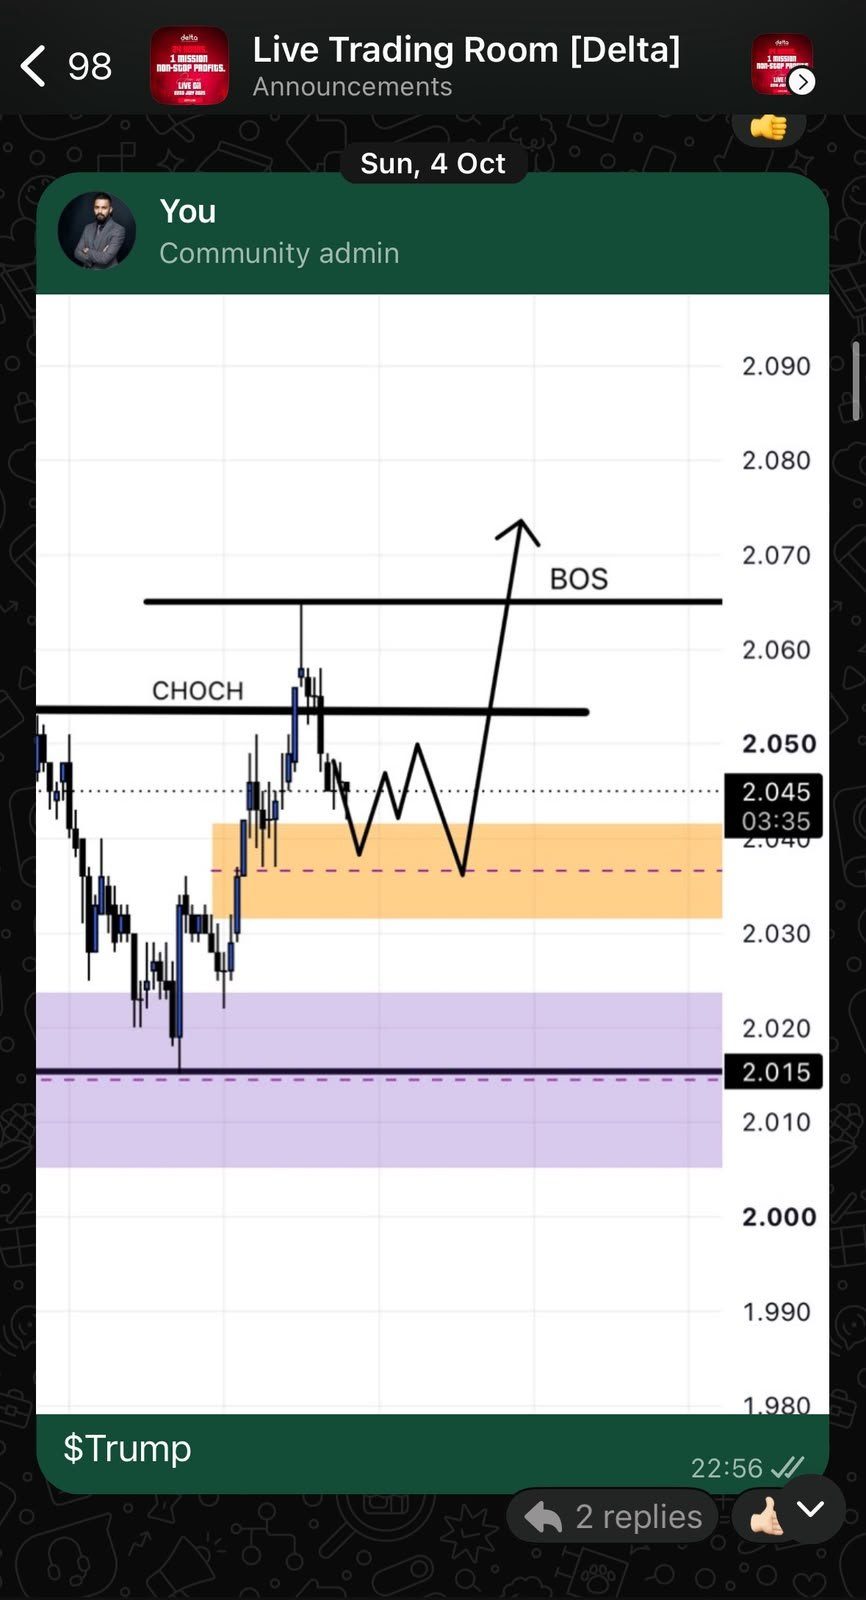
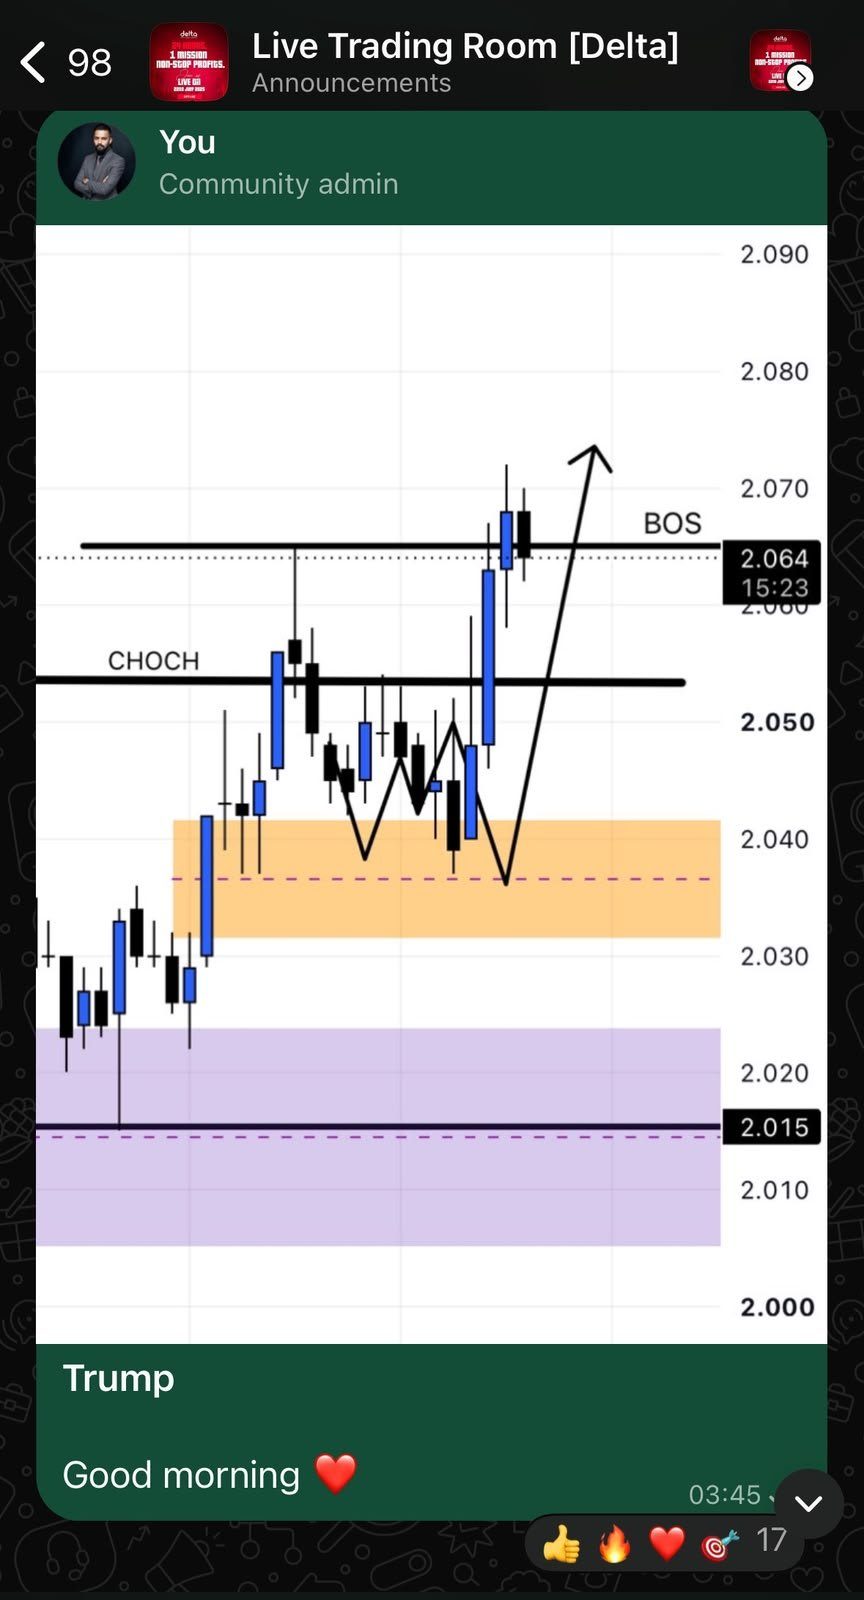
15. $TRUMP: CHoCH First, Then the BOS
Headline on Saturday, structure map on Sunday, breakout as drawn.
BOS ✓ Structure played out as drawn
Why it worked
The 3 Oct headline gave the catalyst. The chart gave the plan: change of character confirmed, expect a zig-zag sweep into the orange demand, then a break of structure.
What happened
Price chopped through the demand exactly as sketched, then broke the BOS line at 2.065. The morning-after post shows the candles on top of the arrow.
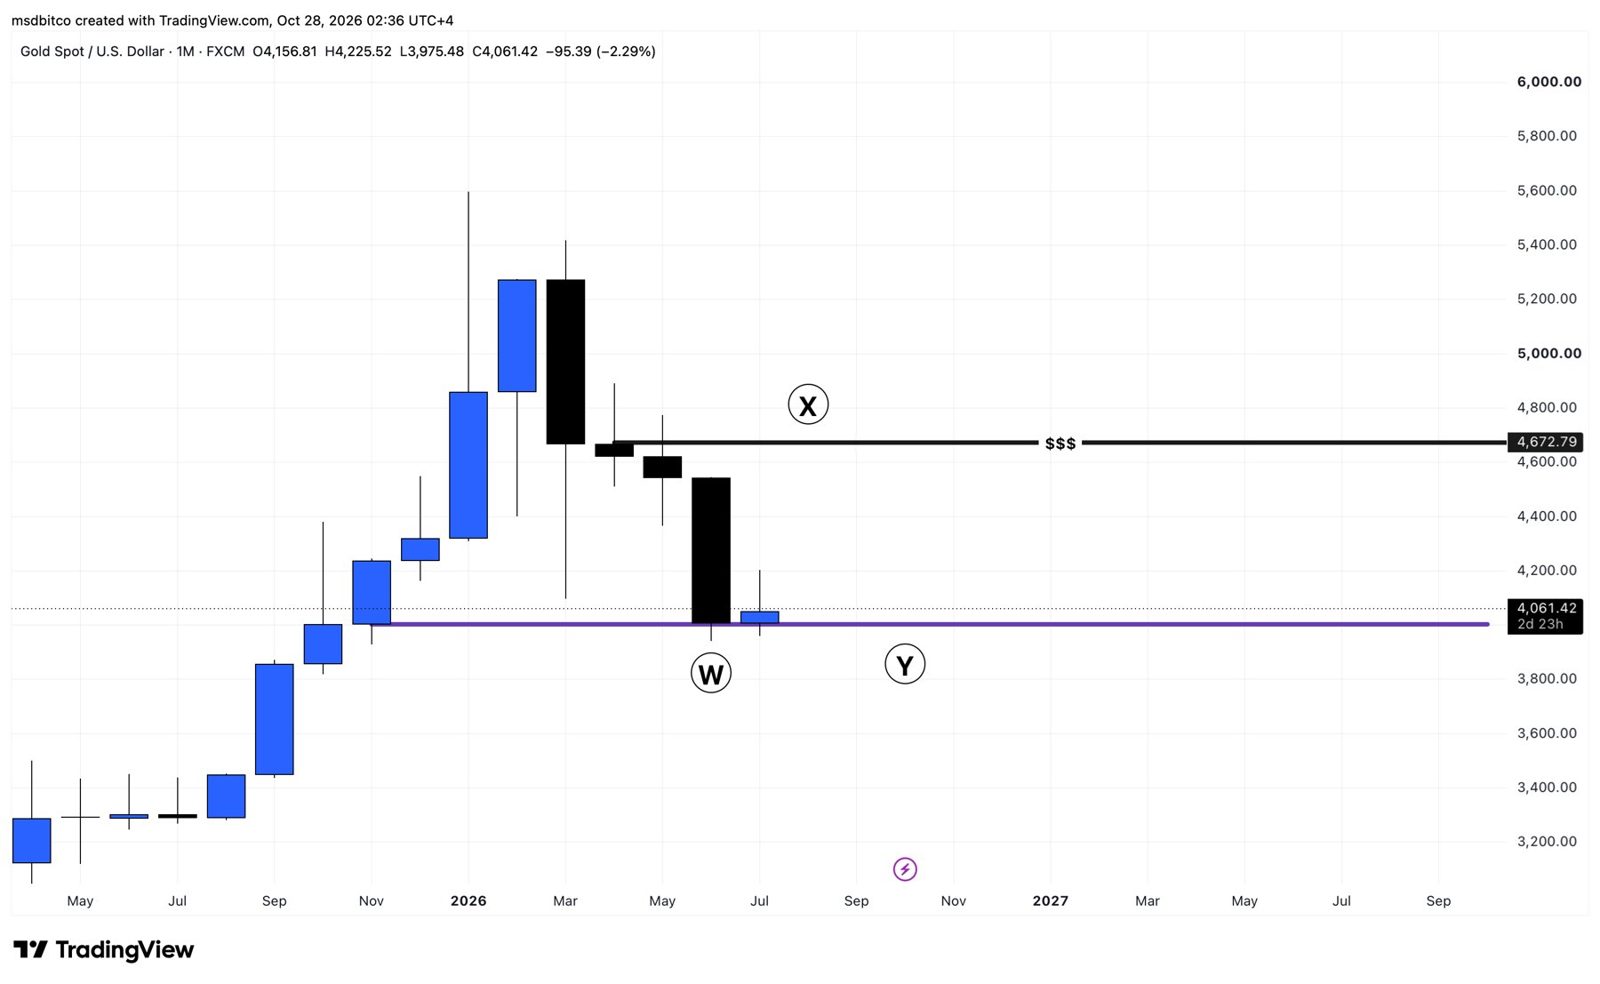
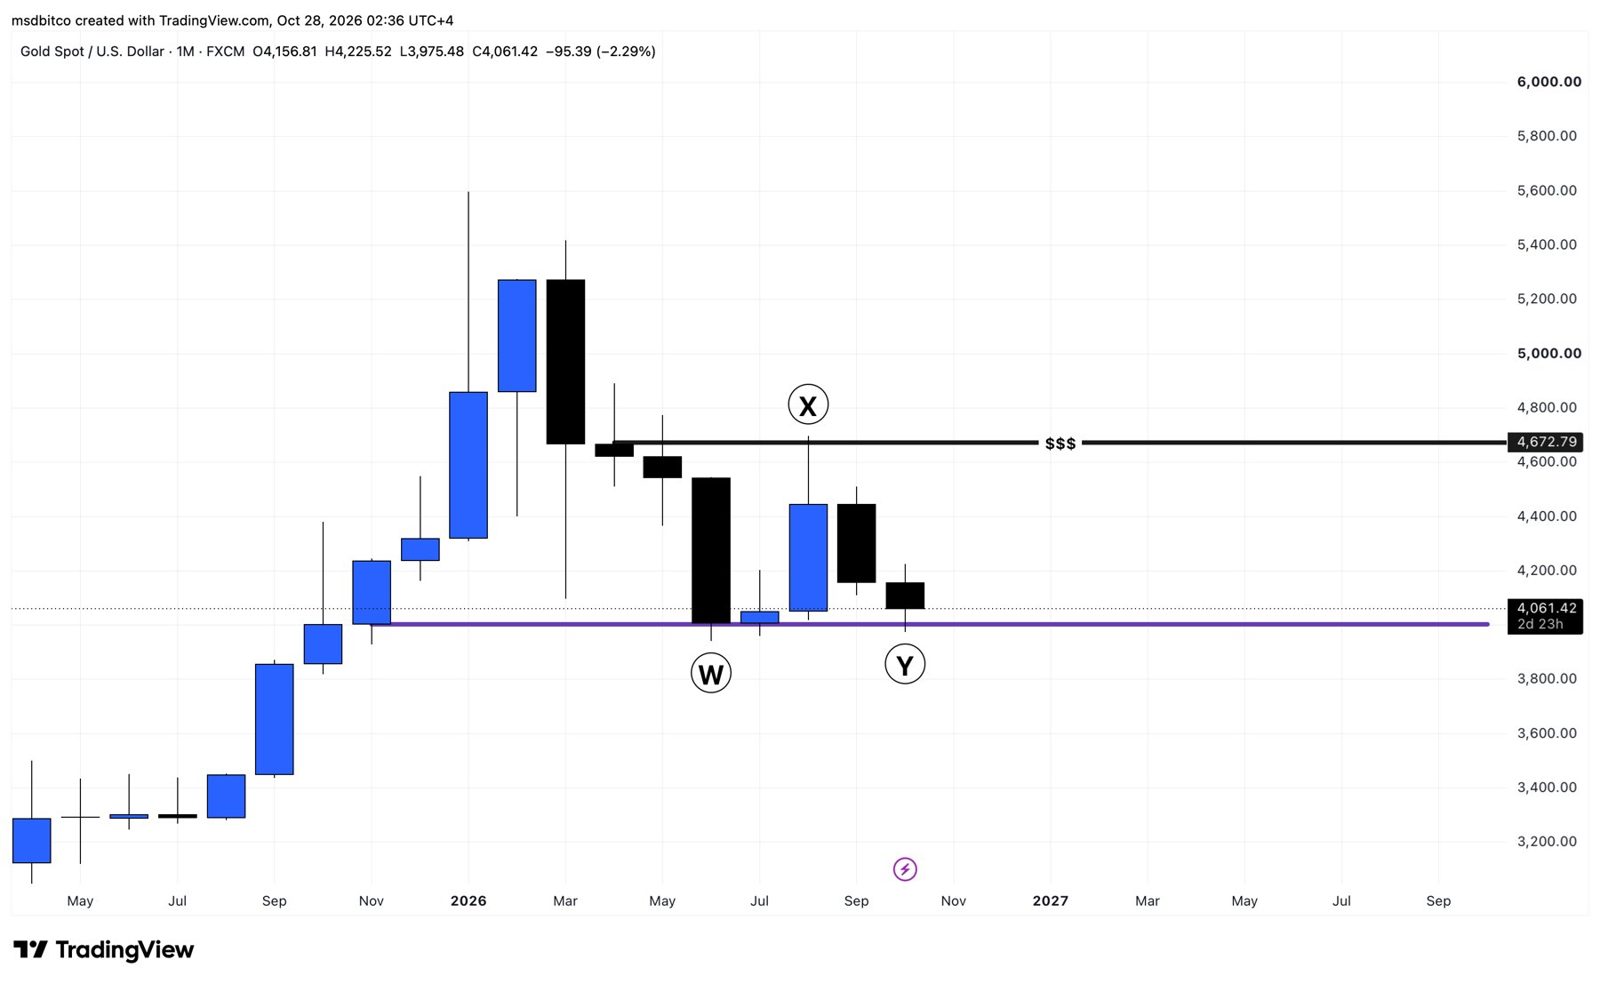
16. Gold 2026: The Monthly Map
Months before it happened, the monthly chart told us where gold would turn: W, X, Y.
$4,672 Mapped X-leg liquidity target
Why it worked
After the 2026 blow-off top, gold built a complex WXY correction. W found the floor at $4,000; X was expected to rally back into the $4,672 liquidity pool, then roll over for Y.
What happened
August’s candle wicked into $4,672 and failed. September and October delivered the Y-leg back toward $4,000, exactly as mapped.
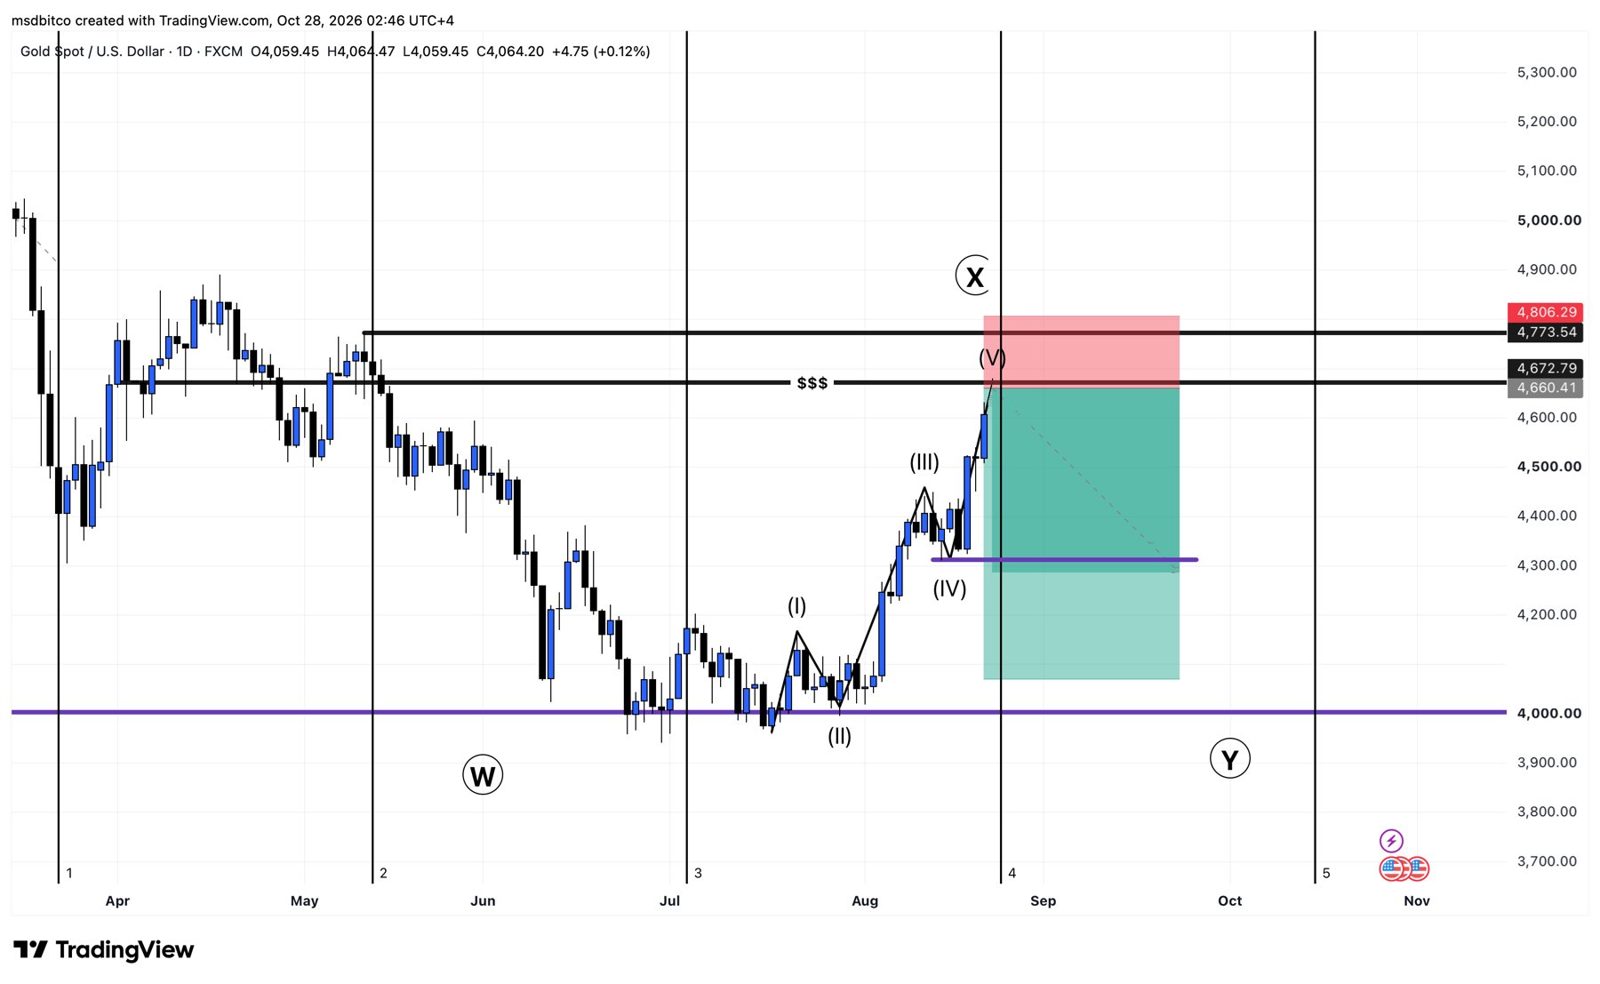
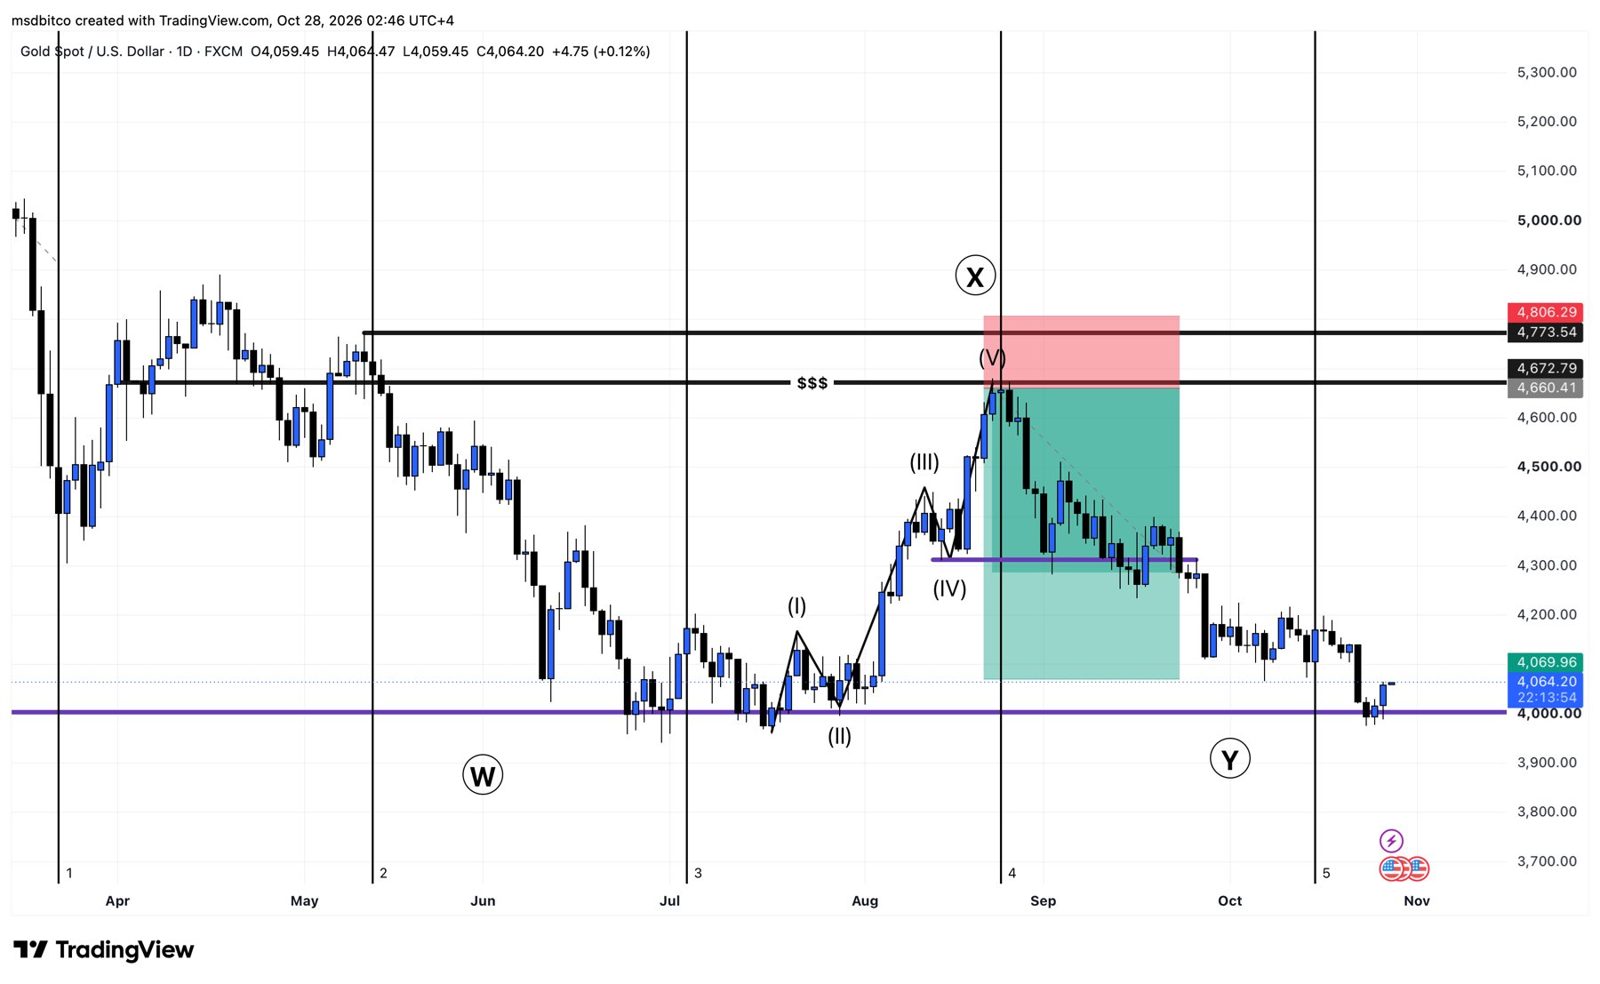
17. Gold 2026: Selling the Top of X
Five waves up, into liquidity, on a time-cycle line. When three methods agree, we act.
+590 pts 1 : 4 · Target reached
Why it worked
A complete five-wave impulse (I)–(V) ended at the $4,672 liquidity line, right on our 4th time-cycle marker. Wave count, liquidity and timing all pointed to the same candle.
What happened
Gold reversed from 4,660, broke the wave (IV) low and slid to the 4,070 target by late October, briefly trading below $4,000.
18. FOMC Live: Buying the End of Wave C
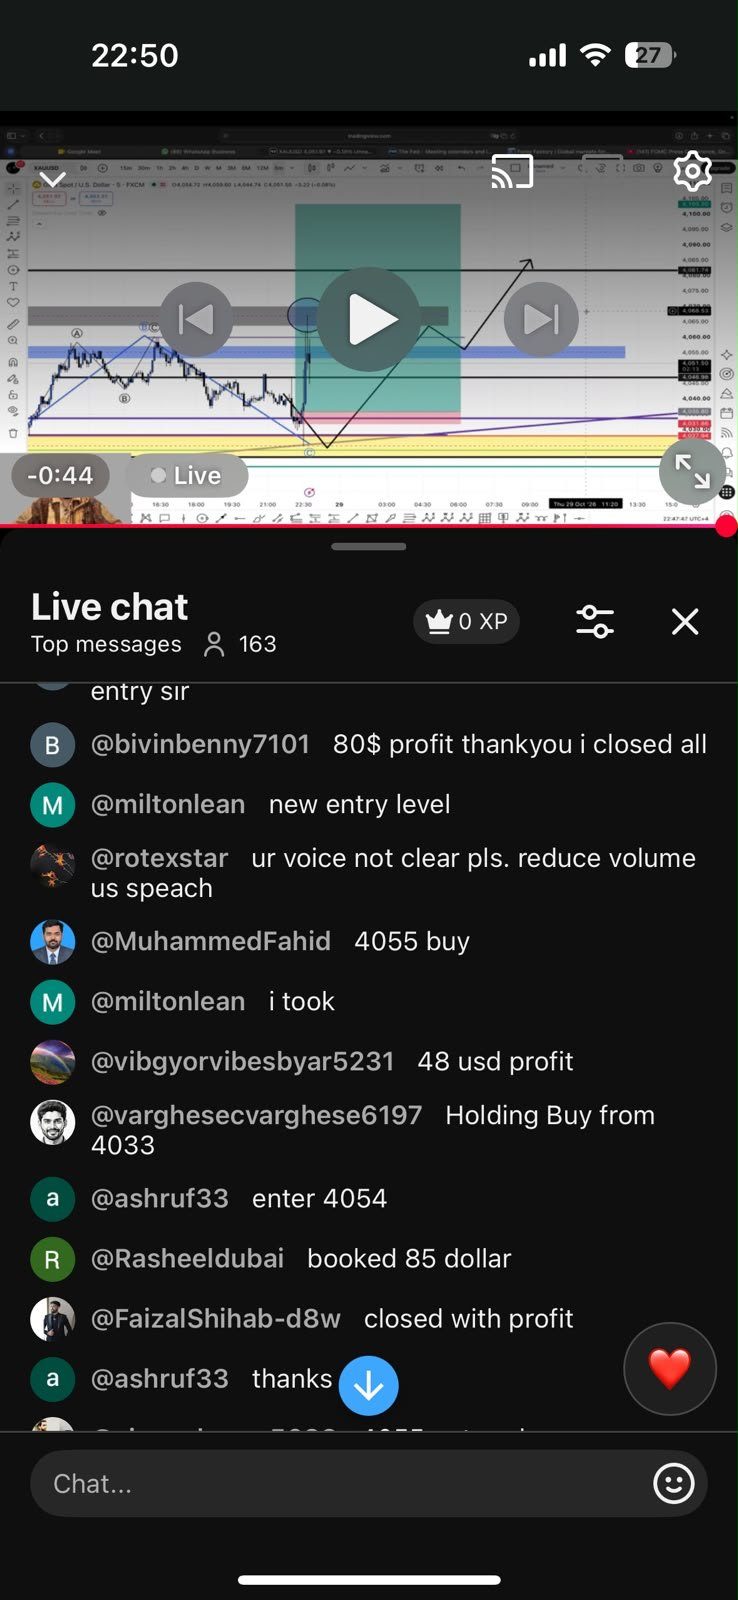
28 Oct 2026. The Fed holds rates. 163 traders watching live. Gold +$39 in under 30 minutes.
+39 pts In under 30 min, live
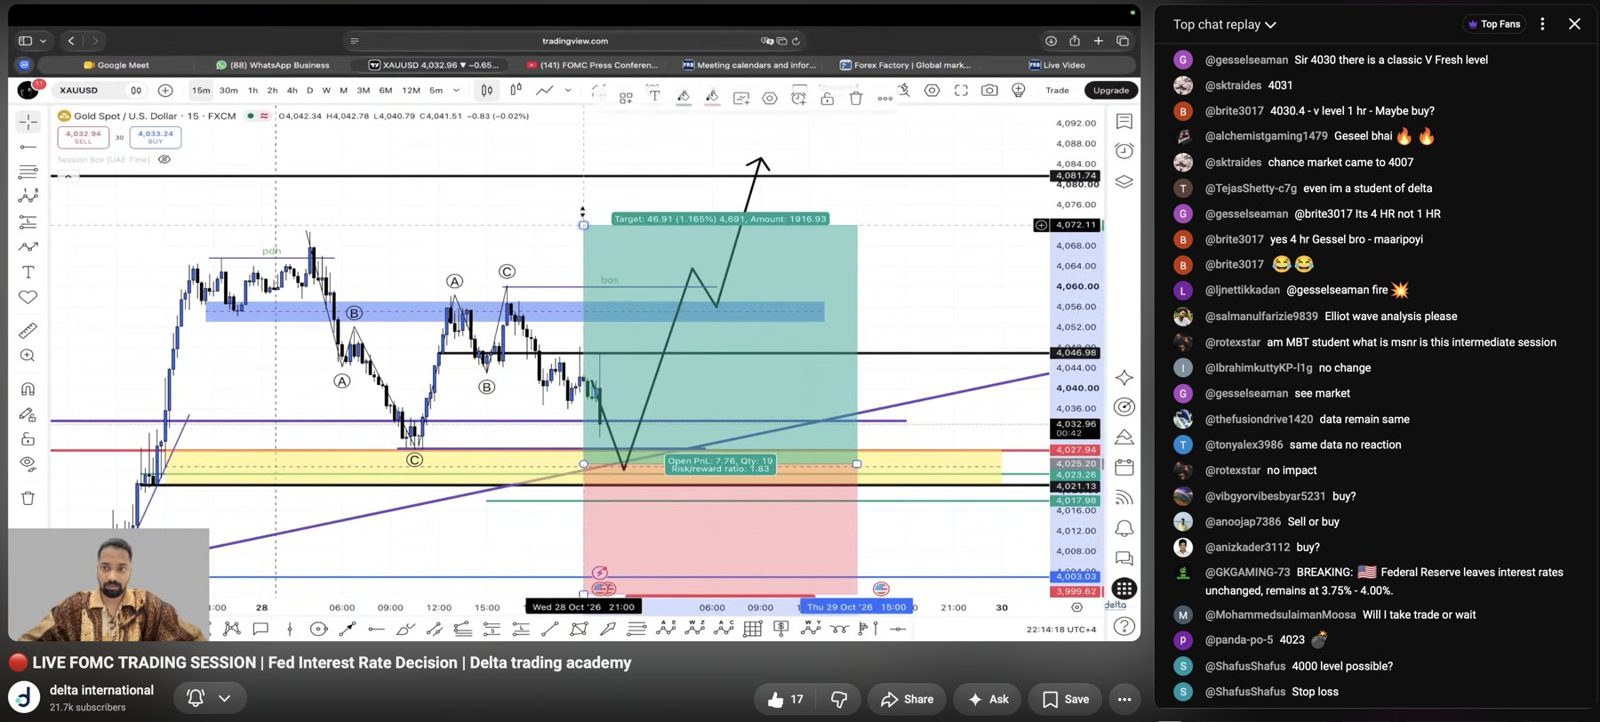
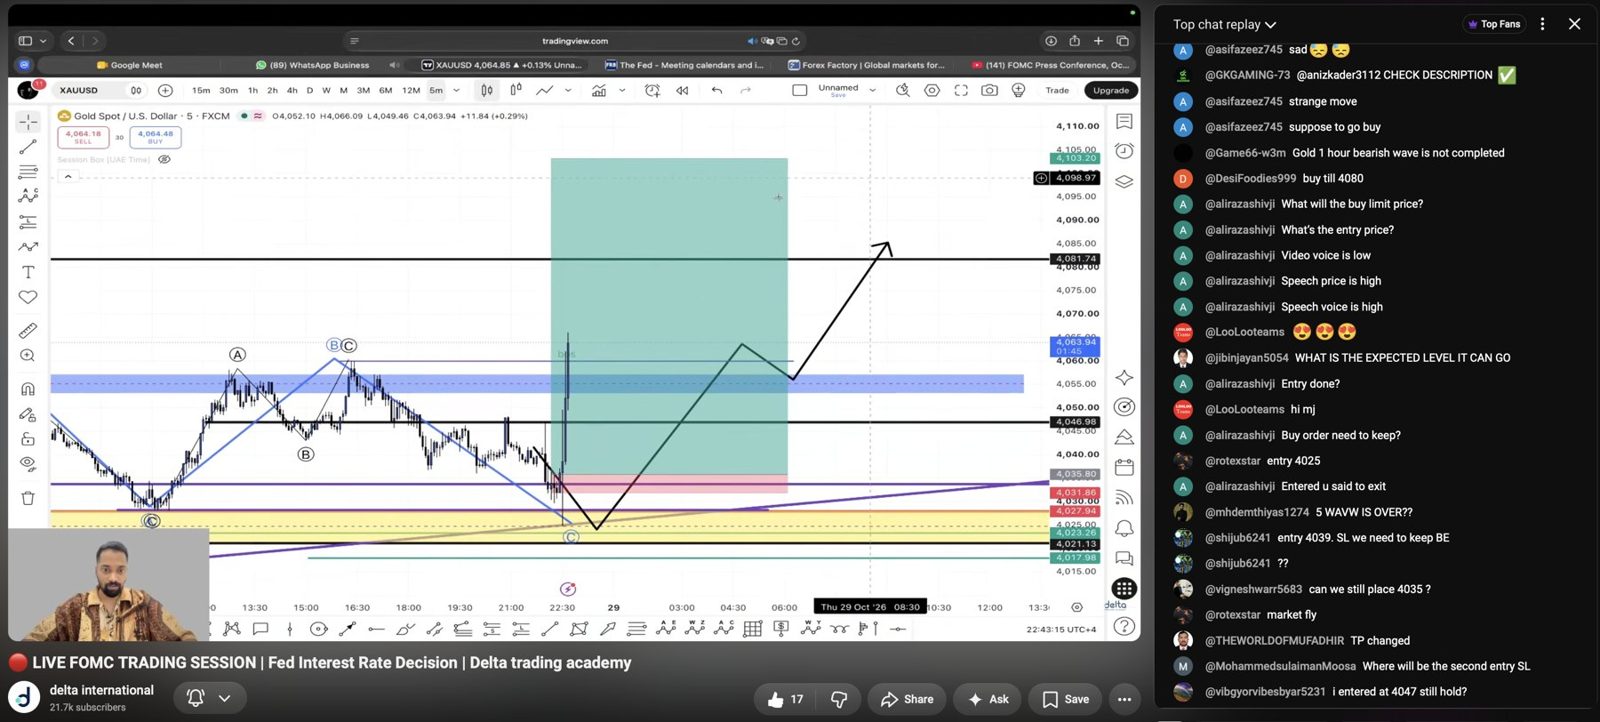
Why it worked
Gold finished an A-B-C correction into the 4,021–4,027 demand zone, right on the rising trendline. The pull-back was over before the Fed even spoke.
What happened
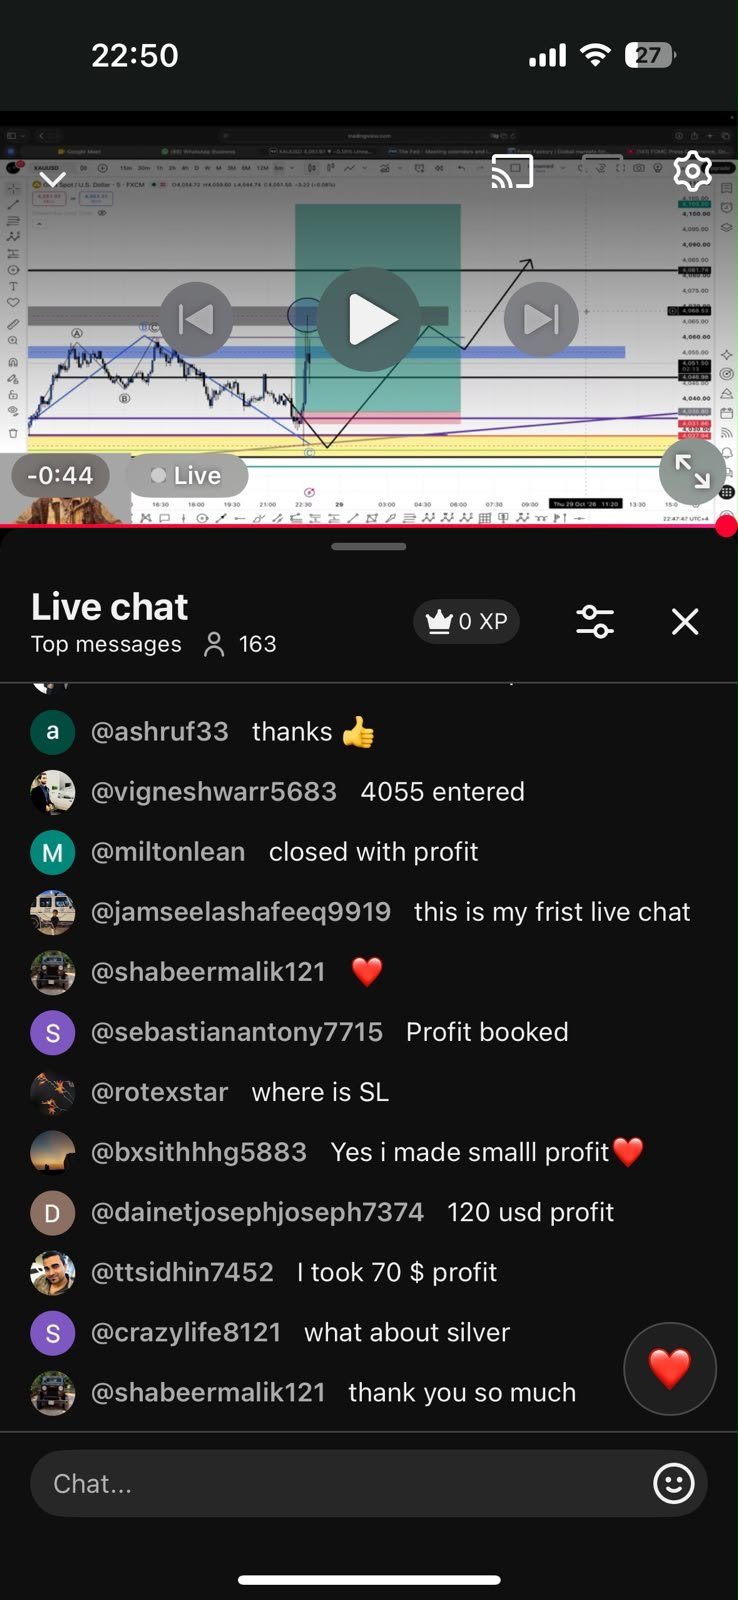
The Fed held rates at 3.75–4.00%. Gold spiked from the C-low to 4,064 by 22:43, and students posted their profits in the live chat within minutes.
Announced, traded live, shared by members
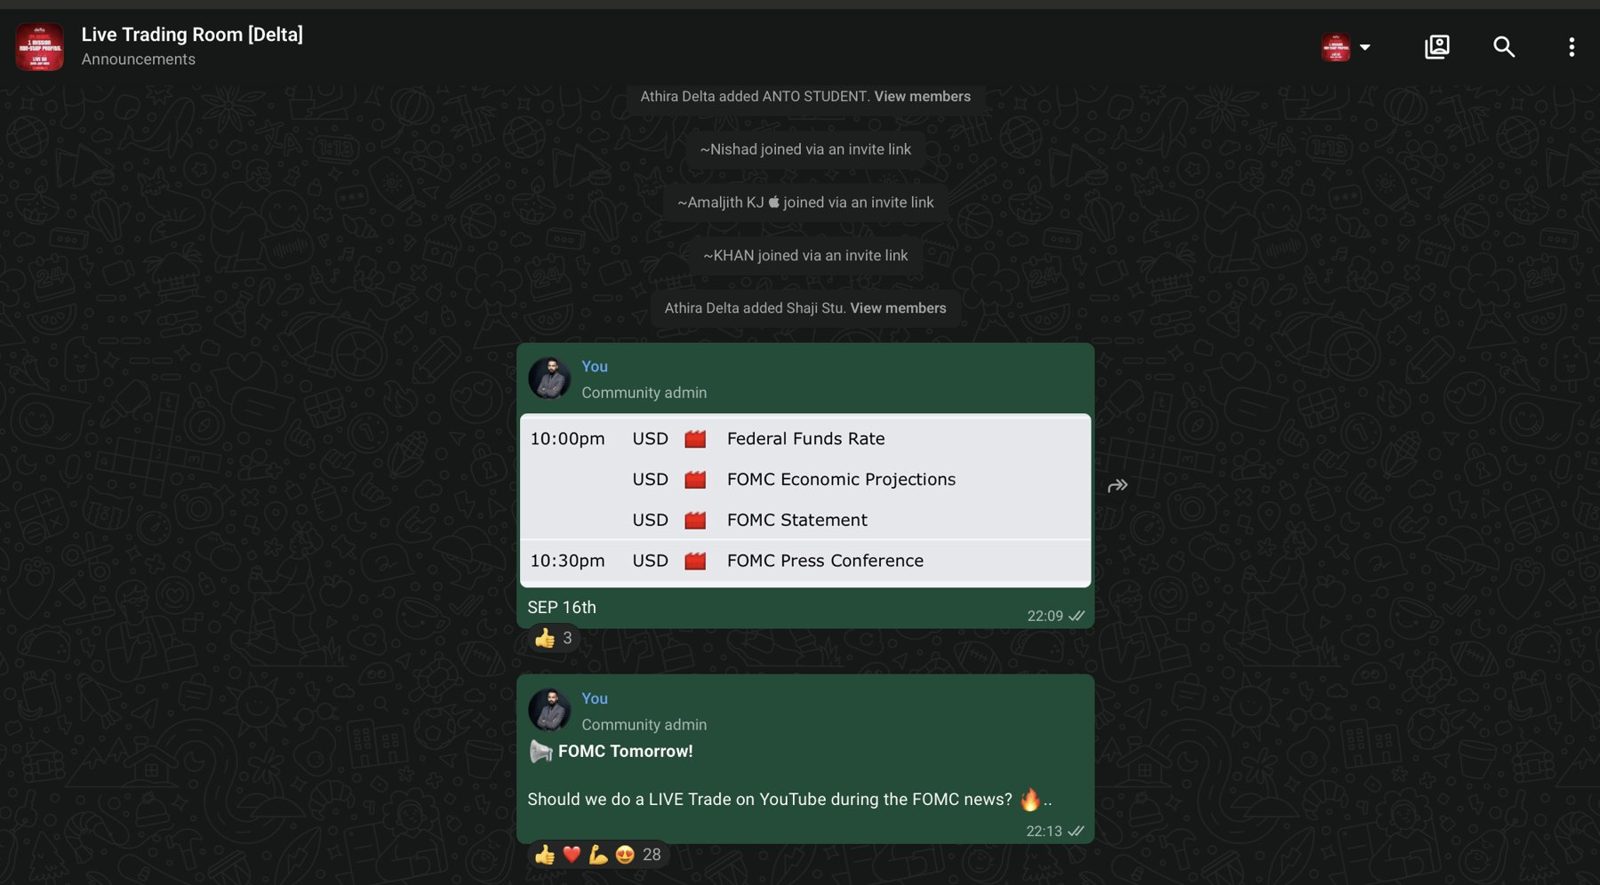
Every FOMC session follows the same routine. The event, time and plan go out in the Live Trading Room the day before. The trade is taken on camera, with the entry, stop and target on screen before the number is released. Then members report back in the live chat.
What every call had in common
Different markets, different timeframes, the same four steps every time:
- Map the story. Start on the higher timeframe: where are we in the wave count, and where is the liquidity?
- Mark the level. MSNR, supply & demand, Gann levels: find where price must react before it gets there.
- Let price come. Limit orders, not chasing. “Don’t directly go for the entry.”
- Manage like a pro. Stop to breakeven, partial profits, a fixed risk per trade. Protect first, profit second.
Honest by design: stops are part of the plan
Not every trade wins, and we post the losses in the same channel as the wins. On 2 July 2025 a EURUSD call hit its stop. The very next message managed the open USDJPY trade: book at 1:1, or move the stop to breakeven to protect capital.
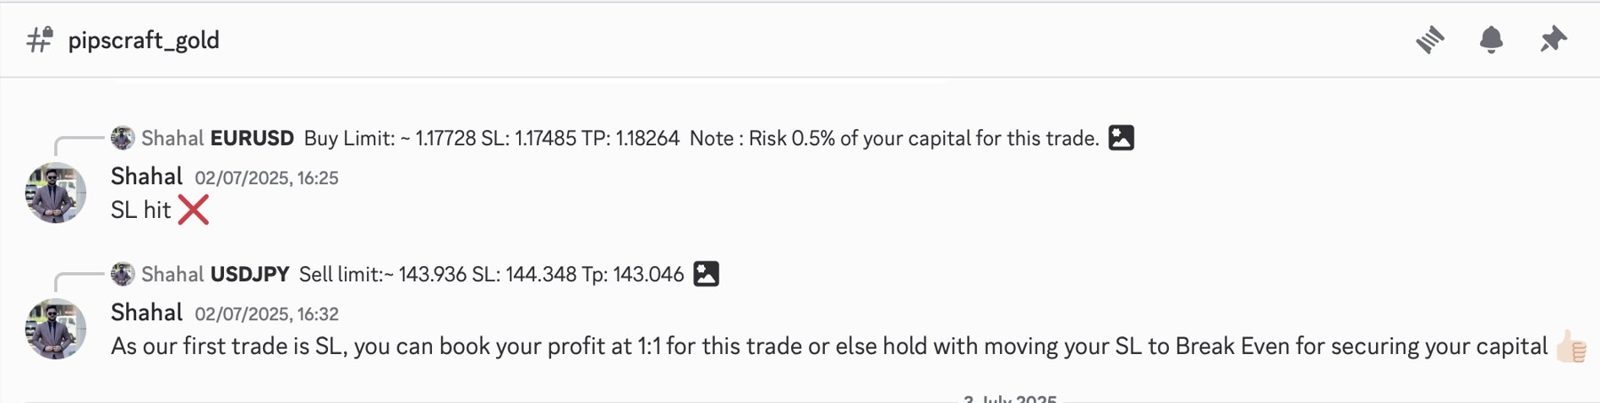
“Keep in mind: every stop-loss carries a lesson. Grow from each one.”
You’ve seen the calls. Now learn the reasoning.
Every level, wave count and liquidity map above is built from concepts we teach step by step and practise together in live markets. Join the next live session on YouTube, follow the levels in the Live Trading Room, or go deeper with the full method in our premium mentorship.
Trading involves substantial risk. Results shown are selected examples from our community archive and do not guarantee future performance. Educational content only, not financial advice.